This post was originally written by IreneAnt and edited and posted by Astrostu.
This past week the Moon Mappers science co-leads, Stuart and Irene, have been in Houston, TX (USA) attending the Lunar and Planetary Science Conference. This is an annual conference where planetary scientists congregate and present their most recent and exciting findings. On Thursday, Stuart and Irene presented their poster based on the Moon Mappers crater counts that citizen scientists have conducted to date.
For the past year, Moon Mappers volunteers have been looking at a region of the Moon near the Apollo 15 landing region. The unusual thing, and some of you may have noticed, is that volunteers have been shown the same region over and over, but with different sun angles.
The sun angle is a measure of how high the sun was in the sky when the image data was collected. When the sun is high over head, as it is at noon on the Earth, there are very few shadows and it can be hard to see surface features such as craters and hills. When the sun is low near the horizon, as it is near dawn and dusk on the Earth, shadows are long and prominent, making topographic features like craters and hills very easy to notice, but the long shadows may also obscure features. To make things confusing, sun angle is measured from the noon position. So, when the sun is high overhead, the sun angle is zero or close to zero. And when the sun is low in the sky, close to the horizon, the sun angle is close to 90 degrees.
What Stuart and Irene wanted to see was if there was an optimal sun angle for measuring craters, and if so, what was it? This has been studied before with mixed results, and given that very few professional researchers are able to devote the time necessary to identify craters on the same terrain in many different sun angle images, we thought this would be an excellent first science project for Moon Mappers volunteers.
To do this for this presentation, we took all of the 1.2 million craters that you have marked so far and compared how many were counted for each different sun angle. First the crater marks were clustered to identify those individual craters that were noted by at least 9 people. Then Stuart himself marked craters in one small part of the study area. We compared Stuart’s craters to the Moon Mappers clustered craters in the one image, just to make sure that the Moon Mappers data was good. Guess what! In general, the Moon Mappers craters are fairly close to the expert’s! Well done citizen scientists!
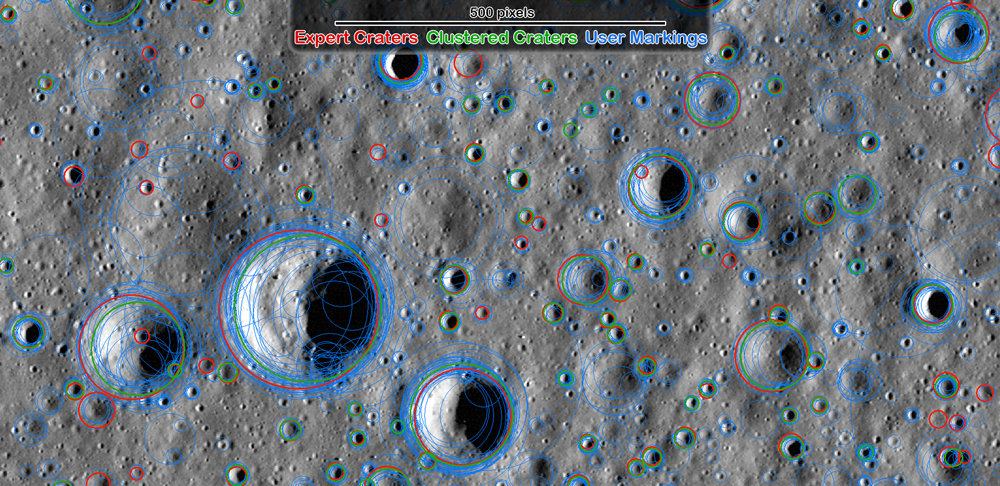
Example of reduced Moon Mappers data showing individual volunteer markings, those markings reduced, and then them compared with an expert’s markings.
Next, we plotted the Moon Mappers craters (from the entire study area) on what is called a cumulative size-frequency distribution (CSFD). Here, each point on the plot shows the number of craters that are smaller than the diameter at the bottom of the plot (the x-axis). So, the point above the 0.1 tick mark on the plot below tells you how many craters have a diameter that is 0.1 km or larger.
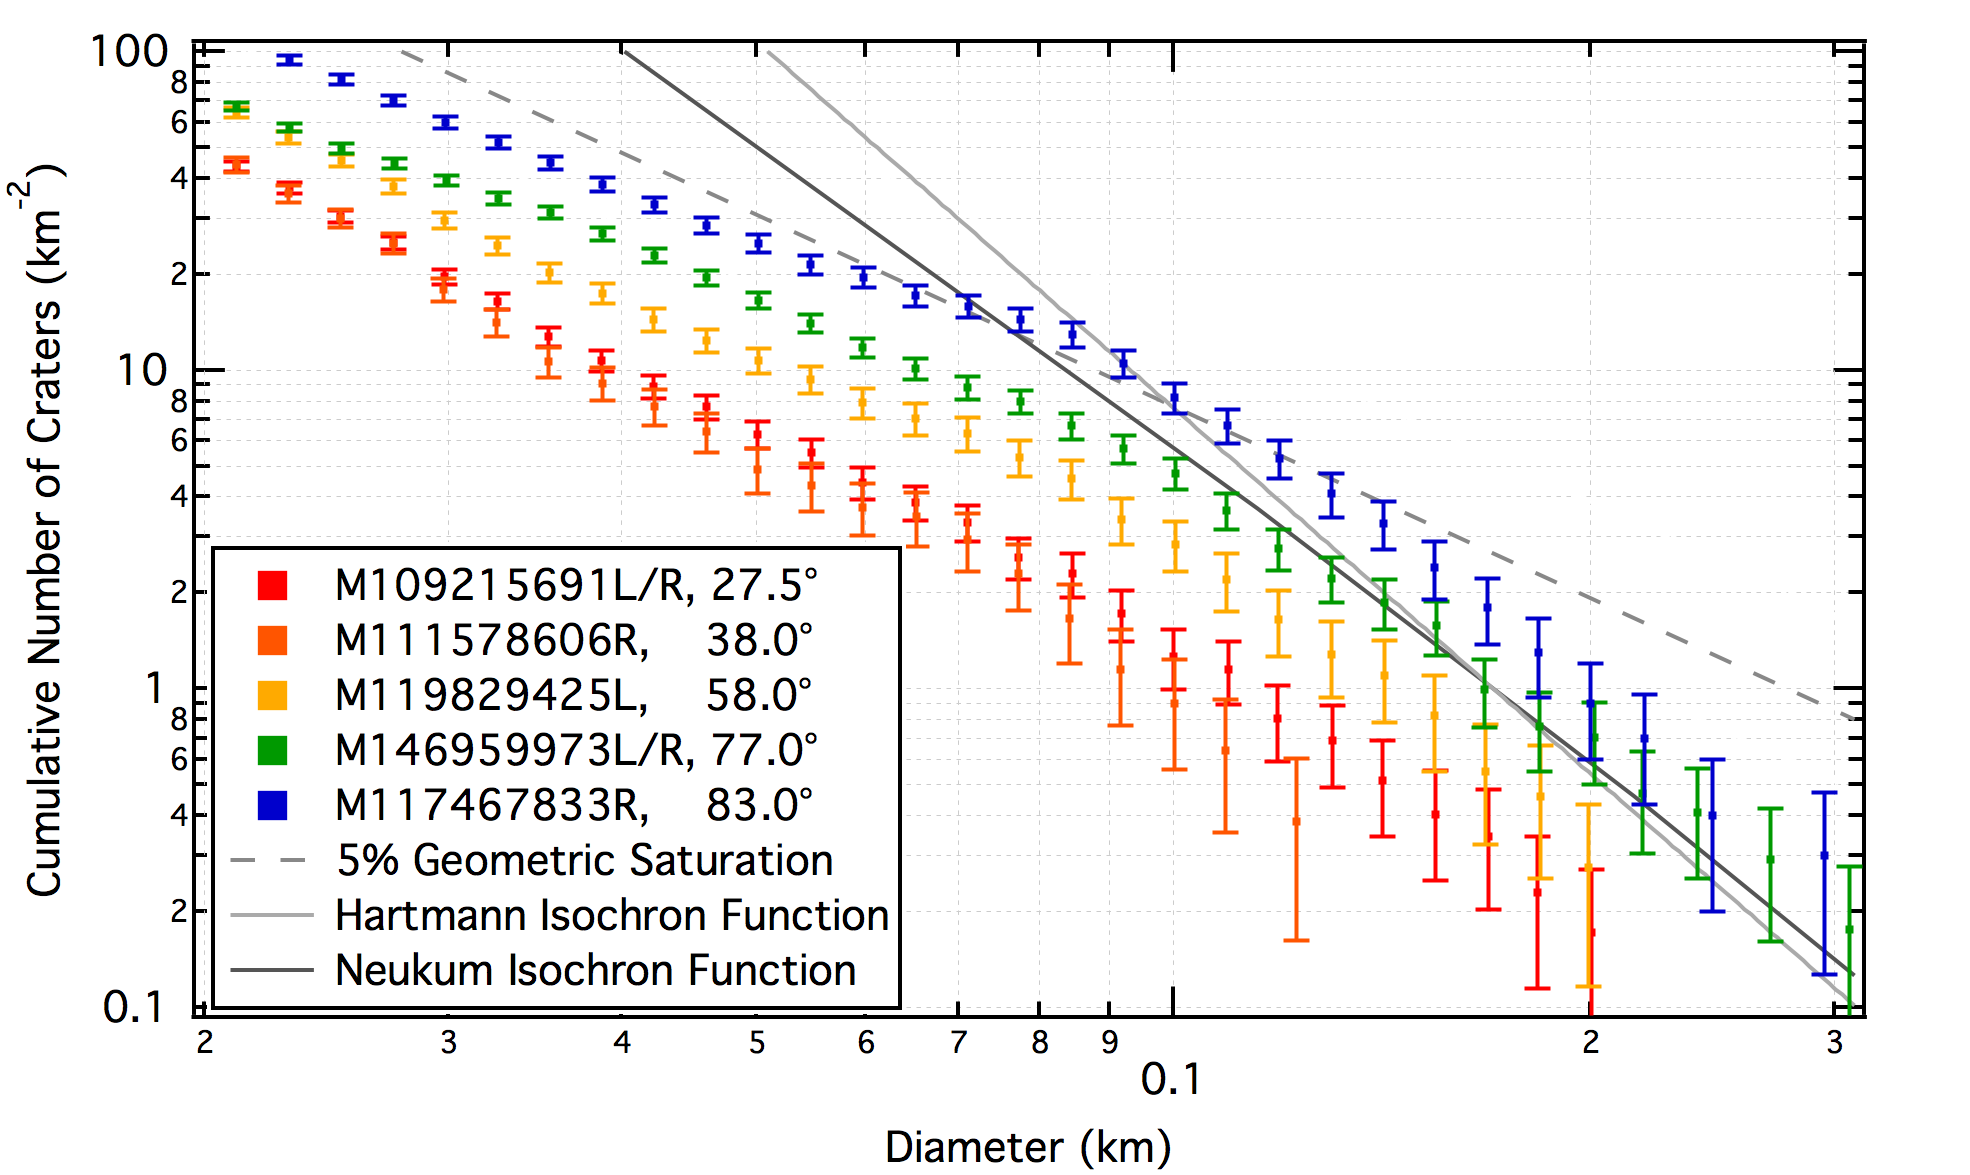
Preliminary Results from Moon Mappers sun angle results. These show that more craters are found when the sun is low on the horizon.
In this plot, you can see that images with different sun angles gave us different numbers of craters. For example, the M1092215691 image (red marks on the plot), which has a sun angle of 27.5° (close to directly overhead), has much less craters than image M117467833 (blue marks on the plot), which has a sun angle of 83.0° (close to the horizon).
Based on our analysis of the data in this plot, we conclude that the best sun angle for counting crater is somewhere between 58° and 77° (fairly close to the horizon, but not too much) – these are pretty exact numbers, but they are the only ones we can use because despite having terabytes of data over hundreds of thousands of images of the Moon, we are still limited in our range.
Based on these, for future projects, Moon Mappers will try to use only images that have a sun angle somewhere within this optimal range.


 Escape Velocity Space News
0 Comments
Trackbacks/Pingbacks