
NASA’s TESS spacecraft, which is primarily used to search for exoplanets, has now observed a veritable symphony of pulsating red giant stars, each with its own internal vibrations. This work was presented at this week’s TESS Science Conference. Plus, some more climate change news (bad) and superflares may be less harmful to exoplanets than thought (good).
Podcast

Transcript
Hello and welcome to the Daily Space. I am your host Dr. Pamela Gay and I am here to put science in your brain.
There is a whole lot about astronomy that is simply luck. This is why Beth likes planets. For the most part, they just don’t do anything quickly, and exceptions like earthquakes can be detected from far away; so as long as you’re looking from somewhere on the planet, you’re going to catch the action.
The sky is big. Stars and such are super tiny. This means on any given night, billions of things that go flicker or flare – or that just happen to be moving – billions of things get missed as astronomers look other places. But occasionally, we get lucky.
The Kepler mission, which was designed to find planets around alien stars, looked at the same part of the sky night after night, week after week, just waiting for the passage of a planet in front of its star. Kepler collected way more data than is of use to planet hunters, and astronomers continue to pour through the data looking for other astronomical phenomena hiding among the orbiting planets.
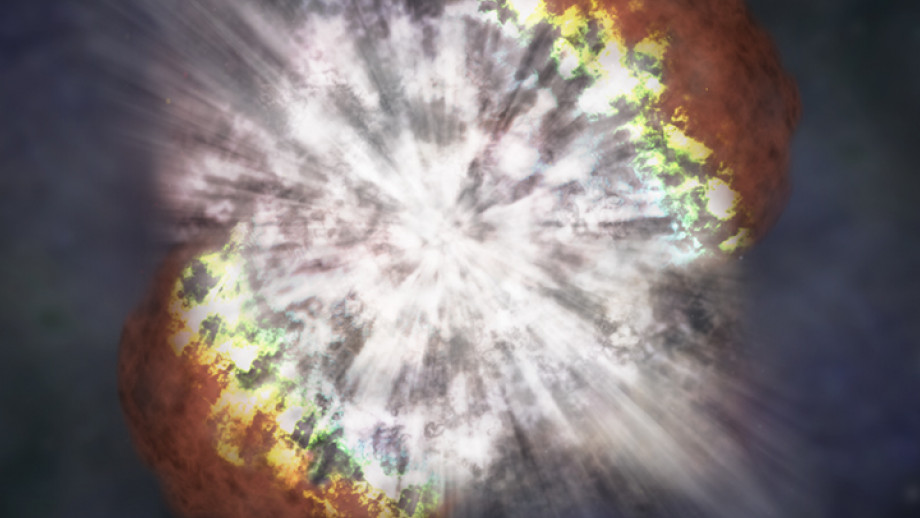
In a new paper that will appear in the Monthly Notices of the Royal Astronomical Society(MNRAS), astronomers have found a massive yellow star that went from hanging out being a massive yellow star to exploding as a supernova all in front of Kepler’s cameras. Stars like this live for millions and millions of years, and the entire pre-explosion warm-up act only lasts days and had never before been seen. Now, thanks to Kepler, we have 40 days of data covering this entire event in amazing, image by image, stop-action detail. This work is led by Patrick Armstrong, who states: We’ve always missed the very, very start of a [supernova] because it is so exceedingly difficult to capture that.
Normally, we spot supernovae when they are at or near the brightest part of their explosion. This data allowed researchers to catch the timing of an early shockwave moving through the atmosphere and signaling the start of the star’s collapse and explosion. This work can be used to constrain existing supernova models and answer questions like how do stars die and what elements do different stars make? One star may not seem like a lot, but in this case, one star is the only star we’ve seen, and it will be our anchor.
I have to admit that it’s the changing nature of stars that makes me love them. A massive star that starts its life ten times the size of the Sun can end its life as an object only two times the mass of the Sun and collapsed down to the radius of Manhattan. All that missing mass is still there, surrounding the stellar remnant as a large colorful marker, saying something interesting happened here.
The problem is, sometimes the leftover bits of one dead star superimpose themselves on the remnants of another dead star, and sometimes, we can’t tell if we’re seeing the chance alignment of two events or the stunning product of a single star putting on a show.
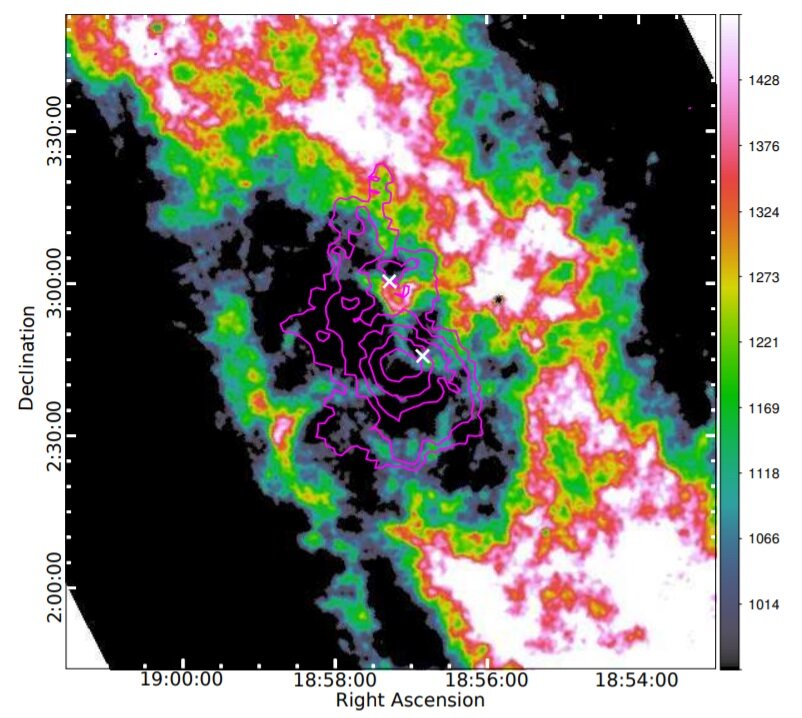
The object HESS J1857+026 was one of these “Is it one or two things aligned” curiosities in the sky. This single patch of sky is home to sources of gamma-ray and radio light and a young, off-center pulsar. When things don’t line up perfectly, it’s easier to believe they may not all be in one place and actually associated with each other.
To get to the bottom of this system, astronomers Alberto Petriella, Laura Duvidovich, and Elsa Giacani imaged the system in a new color – or at least a different shade of radio light. This new data allowed them to determine there is a hot bubble – likely from the original supernova – and the hot bubble is the source of the gamma-ray light, and the pulsar is inside that hot bubble. It is essentially a nesting doll of science. Not a well-stacked nesting doll, but there is a pulsar surrounded by a hot bubble surrounded by a nebula, all shining chaotically in the night, and that is kind of awesome.
Honestly, we are still finding wildly new objects as we explore the sky. Every time we turn on a new kind of telescope – boom! Awesome new mystery. And some of those mysteries are super weird-looking.
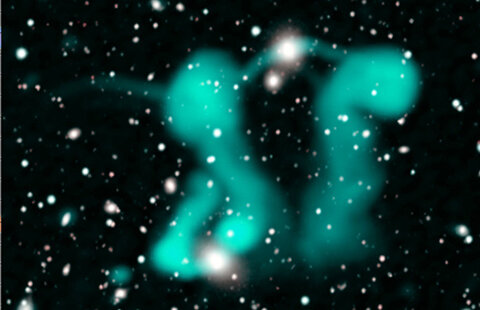
In the first deep sky search with the brand new Australian Square Kilometer Array Pathfinder (ASKAP), astronomers found what they are calling “Dancing Ghosts.” This discovery was released as part of a new radio map of the sky. According to lead researcher Ray Norris: When we first saw the ‘dancing ghosts’ we had no idea what they were. After weeks of work, we figured out we were seeing two ‘host’ galaxies, about a billion light-years away. In their centers are two supermassive black holes, squirting out jets of electrons that are then bent into grotesque shapes by an intergalactic wind.
There is still a lot to learn about this weird-looking system, but it’s good to know it’s not ghosts, and there is new science for people to explore.
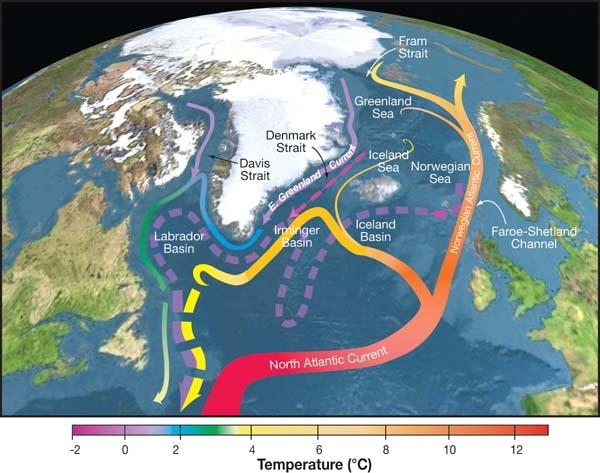
Back in early 2003, I came across an issue of either Science or Nature that had a theory paper in it on how changing the salinity of the Atlantic could cause the amazing currents in that body of water to shut down. Right now, salty water heated in the tropics is circulated northward, and it brings the energy necessary to allow the very northern British isles to have a warm enough climate that there are palm trees. As that energy warms northern Europe, Ireland, and the UK, the water sinks down and circles back toward the tropics along the bottom of the sea. It is the salty at the surface and less salty down deep density differences that allow this circulation pattern to exist. In that magazine issue, they talked about how an influx of fresh water into the Atlantic could shut down that circulation and plunge those northern places into the cold.
And later in the journal, there was an article on how the melting of Greenland’s ice sheets was changing the Earth’s salinity. People who love me took away my general science journals for a while and told me to just look toward the stars, but twenty years later, none of us should be looking away.
New research has shown that, toward the end of the last ice age, a massive glacier lake burst and flooded the Atlantic with fresh water. This shut down the circulation pattern and plunged Europe into a thousand-year ice age. Now, data is showing that changing salinity is causing the current circulation to falter, and at any moment, the freshwater flowing off Greenland could be the final straw that ends this pattern.
We are looking at the potential freezing of the northern latitudes while the tropics warm even more, and the average change is just a degree or so. This is the hard part about averages: you can have massive changes at the extremes, and the middle only nudges a bit.
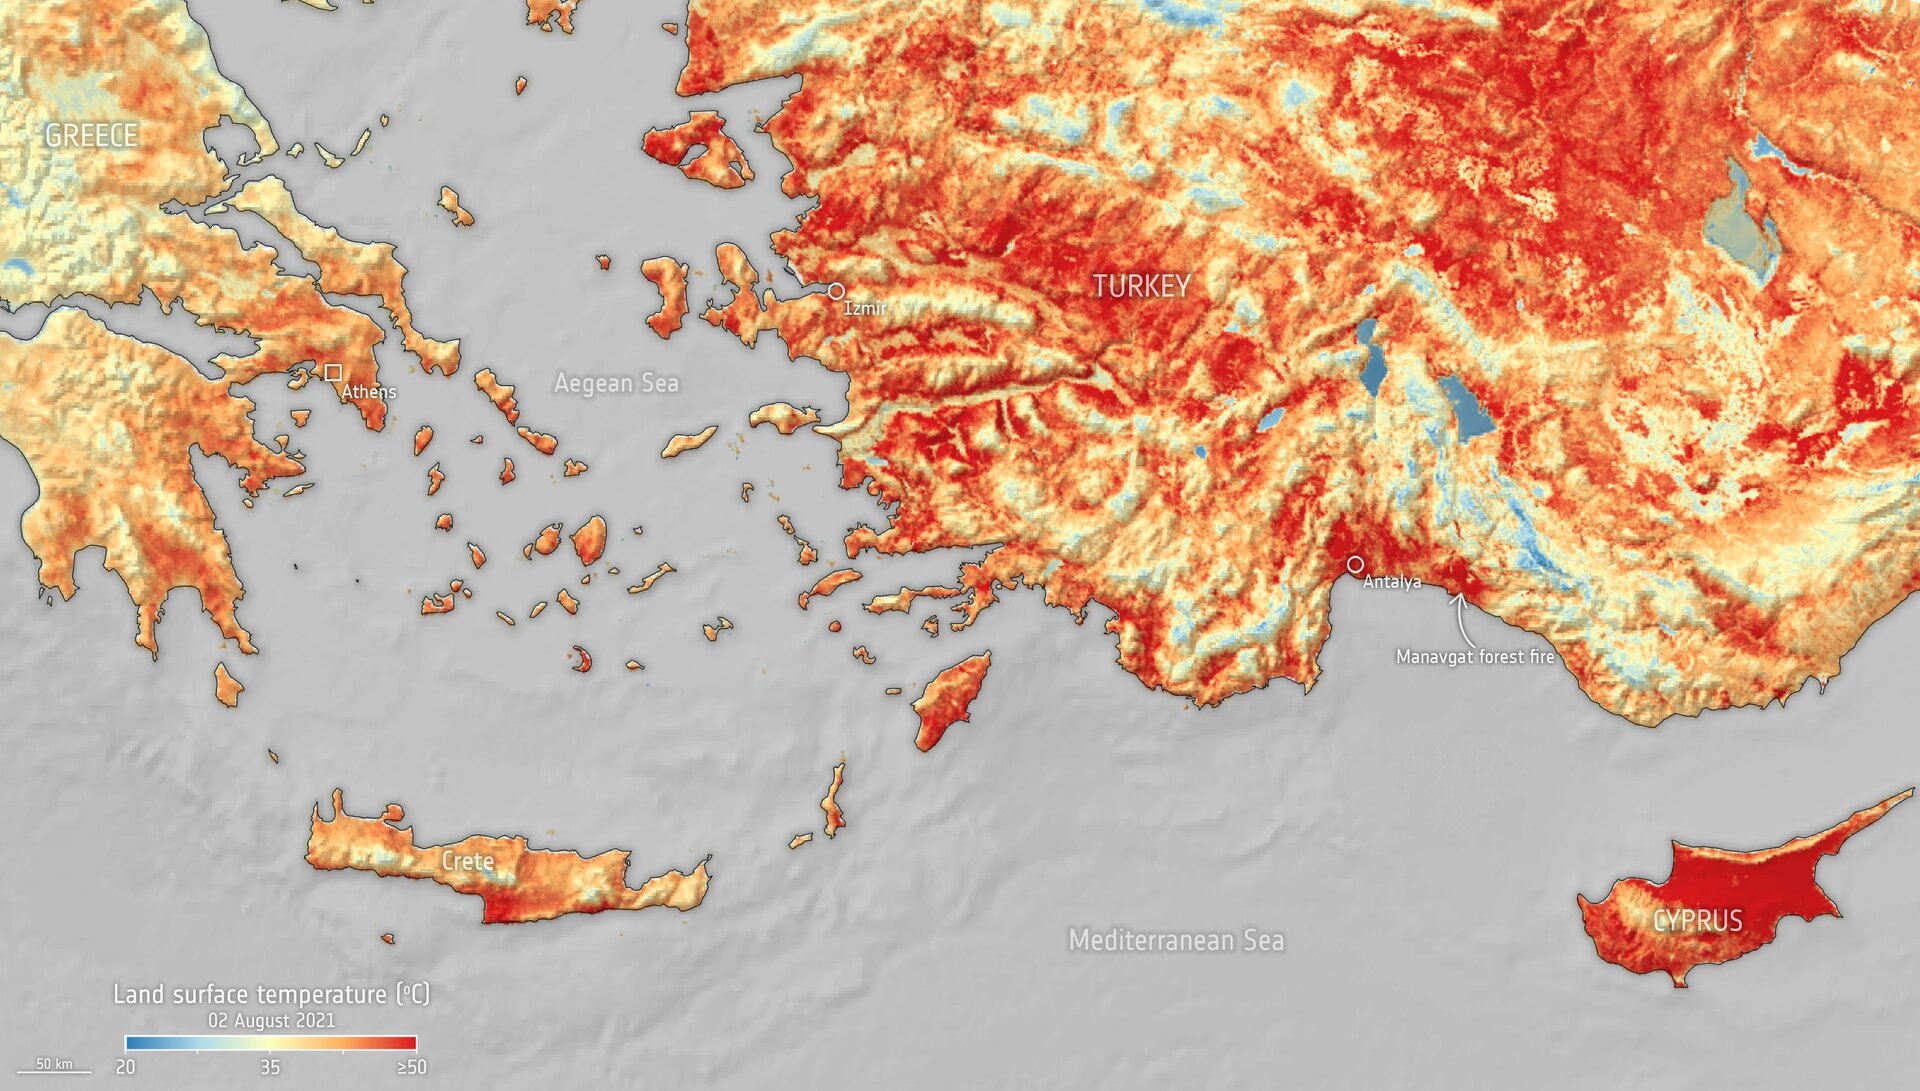
We’re already seeing some of the excessively high temperatures. The Mediterranean is baking, with temperatures in the 100s Fahrenheit and 50s Celsius becoming a new norm for the first time, and wildfires are sweeping through the region. New satellite images from Copernicus Sentinal-3 simply show a world of red where a variety of colors should map temperatures of all kinds across this mountainous region.
There is at least one bright piece of science coming from a different study. The Climate Change Initiative Biomass project is combining ground-based measurements with satellite imagery of the largest forests in the world, which sprawl across Russia’s great western expanses. There they find that the forests are doing more to store carbon than we thought. For several years, we’ve known that, in general, there is increased vegetation productivity and tree cover; however, this work puts a number on that, and the number is a 47% higher sequestration of carbon than previously thought.
This study spanned from 1988 to 2014, and while the data for that period is good, the news for today is more troubling. Since then, fires have become more frequent, and dead trees can’t transform carbon dioxide into oxygen. The smoke of fires changes things not generally for the better.
Folks, our individual footprints can’t stop climate change. Most of the pollutants we worry about are coming from a handful of megacorps. We still have voices, however, and we can sometimes influence those corporations to do better by our world.
And now for something completely different.
I feel like we’ve reported on a lot of TESS stories lately, and that’s actually unsurprising as the TESS Science Conference has been going on this week. I thought all the stories coming out would be about exoplanets, but it turns out, the instruments on TESS are sensitive enough to collect all kinds of data about stars, not just exoplanet transits.
In work presented at the conference, Marc Hon gave an overview of a new all-sky map of red giant stars based on stellar measurements collected over the first two years of the TESS mission. The team was able to determine the masses and sizes of these stars across almost the entire sky, and in doing so, also measured the oscillations of the red giants, creating a symphony.
The press release explains these oscillations by comparing them to sound waves made by everyday music instruments such as guitars. When the string is plucked, it oscillates, and the sound waves can reflect, interact, amplify each other, or cancel themselves out. The same thing basically happens in stars, too, with hot gas rising, cooling, sinking, heating, and rising again. This process produces waves of pressure changes that act just like sound waves — interacting with each other and creating standing waves for minutes at a time that change the brightness of the star. In our own Sun, the changes would be on the order of parts per million, but with these red giants, the pulses happen more slowly and the brightness change can be hundreds of times larger.
Now, just as there are differences between the tones of guitar strings, violin strings, and even cello strings, so, too, are there differences between the pulses in the red giants. These also depend on size and mass as well as other fundamental properties such as the interior structures of the stars. Stars like the Sun eventually expand out into red giants, increasing in diameter by a factor of 10 or more, and that larger distance results in longer wavelengths and larger amplitudes. Using TESS, we can observe millions of fainter, more numerous stars and measure their pulsations.
During the primary mission of TESS, in those first two years, the spacecraft monitored about 75% of the sky, with each camera capturing a 24-by-24-degree image every thirty minutes. When the mission was extended last year, the pace of the image collection increased to every ten minutes. From these images, light curves were developed that measured the change in brightness of nearly 24 million stars over 27 days. That’s how long TESS monitors a section of the sky. And, that’s a LOT of data.
All that data was then analyzed using a machine-learning algorithm that was trained using light curve data from 150,000 stars observed by the Kepler mission. The TESS data turned up 158,505 pulsating red giants. Then the team used even more data from the Gaia mission, which gave them the distances to the star. Once everything was analyzed, the masses of the stars were plotted across the sky. The press release explains: Stars more massive than the Sun evolve faster, becoming giants at younger ages. A fundamental prediction in galactic astronomy is that younger, higher-mass stars should lie closer to the plane of the galaxy, which is marked by the high density of stars that create the glowing band of the Milky Way in the night sky.
And coauthor Daniel Huber sums up the work by saying: Our map demonstrates for the first time empirically that this is indeed the case across nearly the whole sky. With the help of Gaia, TESS has now given us tickets to a red giant concert in the sky.
There are some amazing videos and graphics, including a sonification of three different stars, that we will link to in our show notes at DailySpace.org. The full paper will be published in The Astrophysical Journal.
With last year’s extension, TESS continues its mission, collecting vast amounts of stellar data and helping us discover even more exoplanets, all in the name of finding that elusive habitable Earth 2.0 and maybe even extraterrestrial life. We all know that’s the end game. And while red giant stars are amazing, they’re also late-stage stars that have probably destroyed the nearest planets. Of far more interest to astrobiologists and SETI researchers are the more numerous and much smaller red dwarf stars. These stars can have planets much closer in, and the resulting dips in brightness due to transits are easier to measure as a result.
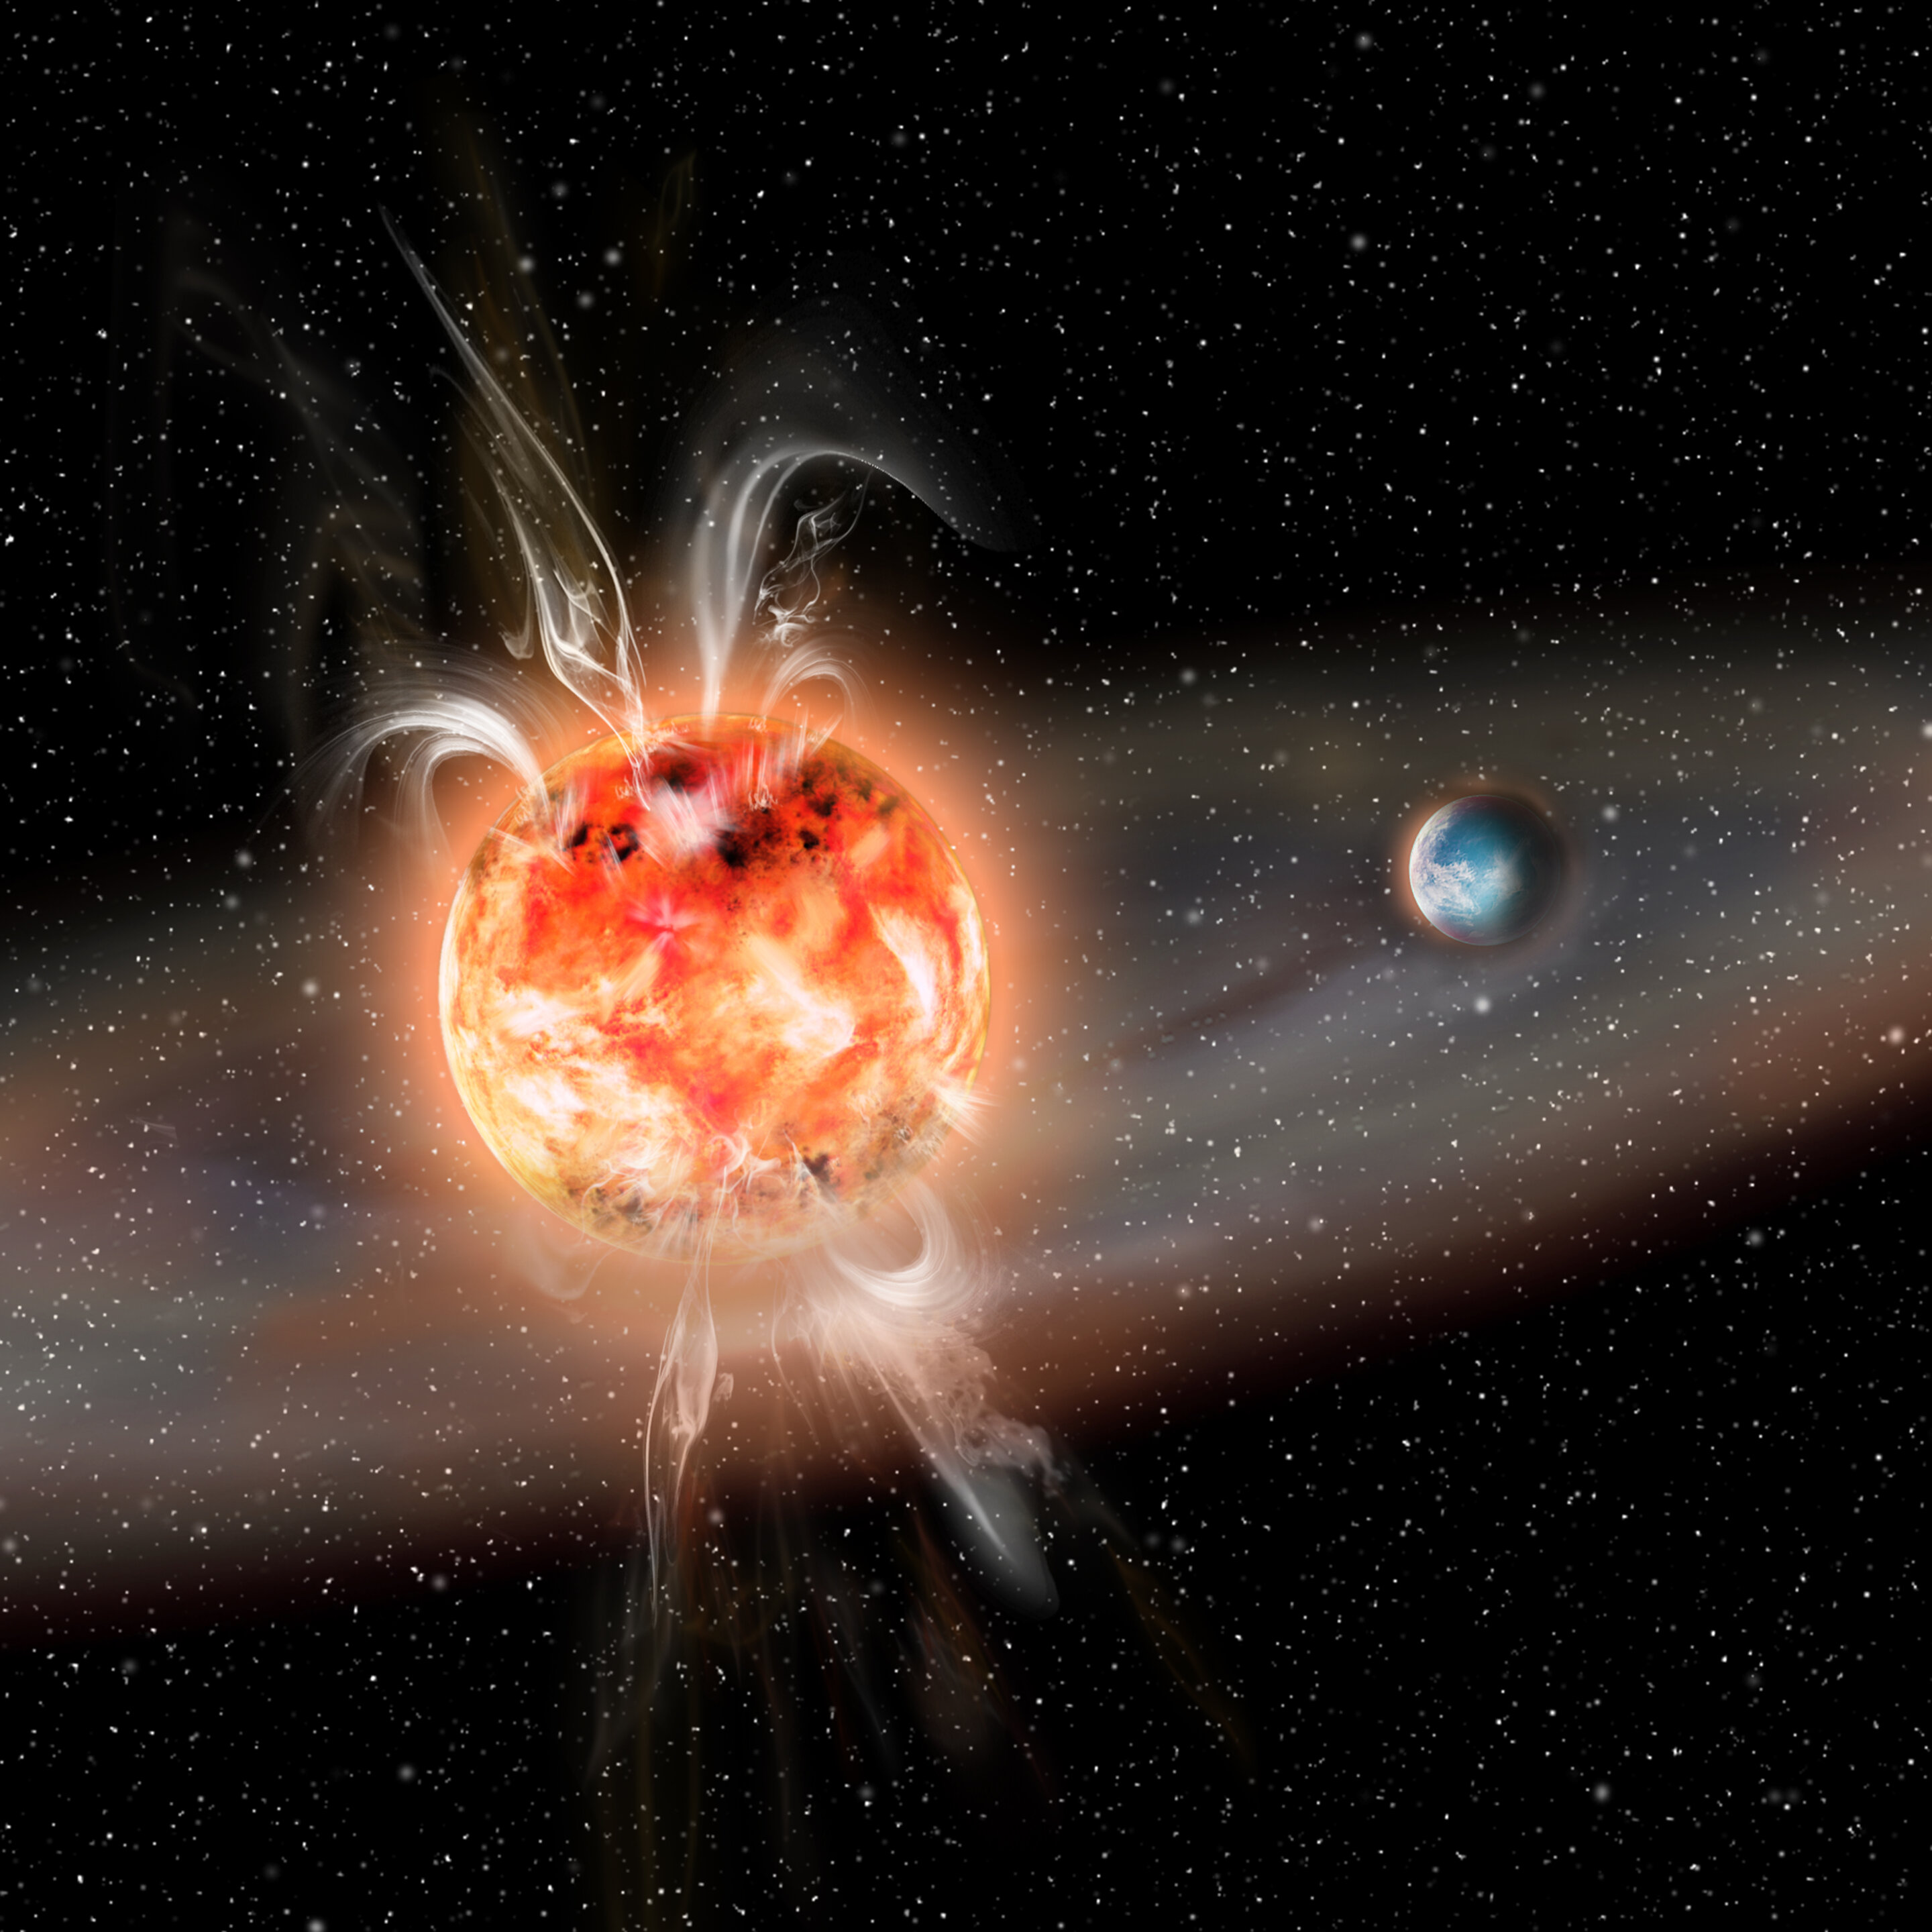
Except that the hypothesis for years has been that any planets orbiting close in to a red dwarf will be sterilized by the superflares from the star. Superflares are extreme bursts of radiation. Our Sun gives off flares as well, but because it’s larger and older, the Sun’s flares are less frequent and less intense than those of the very young, active red dwarfs. This is why scientists thought that life was unlikely on worlds around red dwarfs.
Once again, enter the TESS spacecraft. Scientists at the Leibniz Institute for Astrophysics Potsdam analyzed optical observations from TESS to understand just how and where these flares occur on the surface of the stars. What they found is good news for potential life in these systems. Graduate student and lead author Ekaterina Ilin explains: We discovered that extremely large flares are launched from near the poles of red dwarf stars, rather than from their equator, as is typically the case on the Sun. Exoplanets that orbit in the same plane as the equator of the star, like the planets in our own solar system, could therefore be largely protected from such superflares, as these are directed upwards or downwards out of the exoplanet system.
This work, published in MNRAS, also provides more evidence that sunspots and flares tend to form close to the poles of fast-rotating stars like these red dwarfs. The team found over 3000 red dwarf stars that had large flares recorded in the TESS observations. From those thousands of flares, they found four that worked with the analytical method they created, and those four stars had flares that occurred above 55 degrees latitude. That may seem like a very small data set, but the chances of finding four flares in a row at these latitudes are about one in 1,000, per the press release.
So maybe red dwarfs aren’t such a bad place to look for biosignatures and technosignatures after all. We’ll be curious to see where this avenue of research goes from here.
Until then, this has been the Daily Space.
Learn More
Off-Label Telescope Use Finds Star Signalling Explosion
- Australian National University press release
- “SN2017jgh – A high-cadence complete shock cooling lightcurve of a SN IIb with the Kepler telescope,” P Armstrong et al., 2021 August 3, Monthly Notices of the Royal Astronomical Society
HESS J1857+026 Turns Out to be Layered Puzzle
- Study sheds more light on the nature of HESS J1857+026 (Phys.org)
- “Radio study of HESS J1857+026. Gamma-rays from a superbubble?“, Alberto Petriella, Laura Duvidovich, and Elsa Giacani, to be published in Astronomy & Astrophysics (preprint on arxiv.org)
New Telescope Reveals “Ghosts” of Light
- Western Sydney Unversity press release
Climate Change Will Mean More Ice
- A critical ocean system may be heading for collapse due to climate change, study finds (The Washington Post)
- “Observation-based early-warning signals for a collapse of the Atlantic Meridional Overturning Circulation,” Niklas Boers. 2021 August 5, Nature
The Mediterranean Only Sees Temperatures in Red
- ESA press release
But at Least There Are Trees?
- ESA press release
- “Russian forest sequesters substantially more carbon than previously reported,” Dmitry Schepaschenko et al., 2021 June 17, Nature Scientific Reports
TESS Maps Symphony of Pulsating Red Giant Stars
- NASA Goddard press release
- “A ‘Quick Look’ at All-Sky Galactic Archeology with TESS: 158,000 Oscillating Red Giants from the MIT Quick-Look Pipeline,” Marc Hon et al., to be published in The Astrophysical Journal (preprint on arxiv.org)
Red Dwarf Superflares Less Harmful Than Thought
- AIP press release
- “Giant white-light flares on fully convective stars occur at high latitudes,” Ekaterina Ilin et al., 2021 August 5, Monthly Notices of the Royal Astronomical Society
Credits
Written by Pamela Gay and Beth Johnson
Hosted by Pamela Gay
Audio and Video Editing by Ally Pelphrey
Content Editing by Beth Johnson
Intro and Outro music by Kevin MacLeod, https://incompetech.com/music/
 We record most shows live, on Twitch. Follow us today to get alerts when we go live.