Researchers find that the “oddball supernova” of a curiously cool, yellow star was lacking the hydrogen content expected, “stretching what is physically possible.” Plus, finding potentially habitable planets, a gamma-ray burst, ash clouds, and a new lunar map in this week’s What’s Up.
Media
Transcript
Hello and welcome to the Daily Space. I am your host Dr. Pamela Gay.
And I am your host Beth Johnson.
And we are here to put science in your brain.
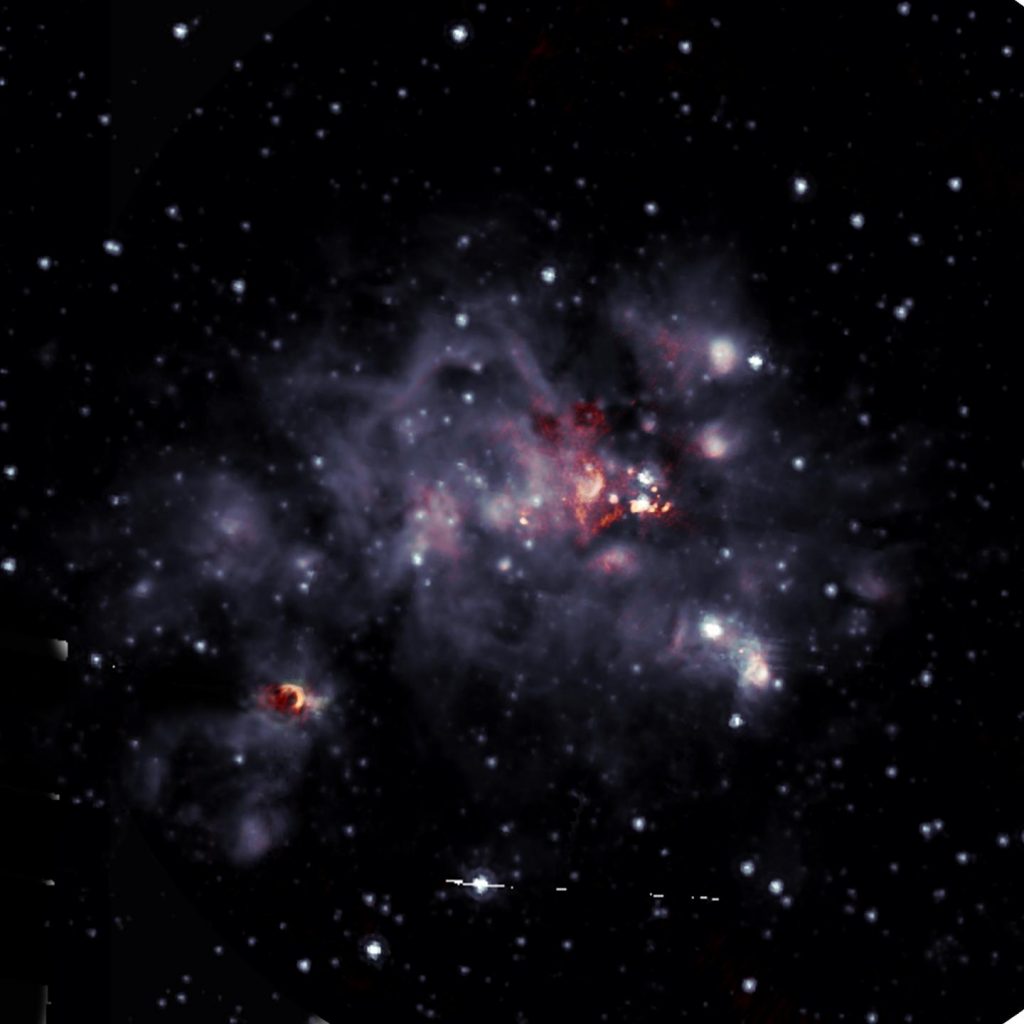
Sometimes, science is just pretty. Researcher Christopher Dupree and his students have acquired new, high-resolution images of the W49A star-forming region using the Very Large Array (VLA). Combined with data from the IRAM Northern Extended Millimeter Array, they were able to spy new details. According to the paper, published in The Astronomical Journal, these observations reveal new morphologies, new structures, to the forming stars and their surroundings. This includes a bipolar structure associated with one of the stars and the revelation that one of the sources can be resolved into three sub-sources in the higher-res images.
What all this means is for another paper and another day. For now, we encourage you to go to our website, DailySpace.org, and check out this image in its full, high-resolution glory.
One of the awesome things about studying space and astronomy is that the science can jump between being really darn pretty and really darn meaningful. Astronomy can answer how did it start and how will it end, and in planetary science, we can look for “where might there be life”.
Before we found planets, it was good enough to say, “If a planet is in its star’s habitable zone, where water can be liquid, it could have life.” Now that we are finding planets in that place, we’d like to be a bit more specific. Researcher Brendan Dyke and his team have taken inspiration from our own Earth as they look for the answer. It turns out, it all comes down to the iron.
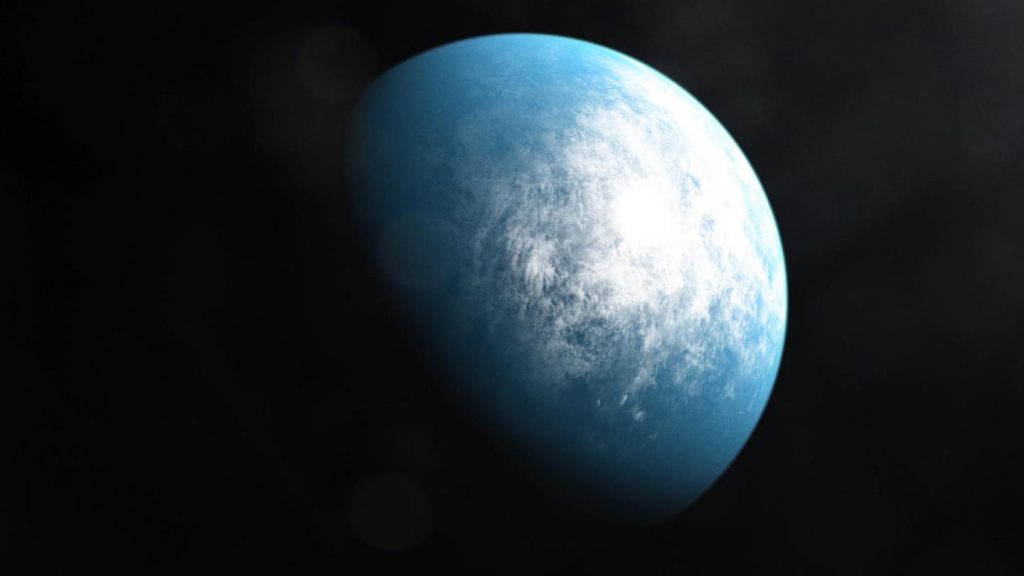
According to Dyke: Just because a rocky planet can have liquid water doesn’t mean it does. Take a look right in our own solar system. Mars is also within the habitable zone and although it once supported liquid water, it has long since dried up. Our findings show that if we know the amount of iron present in a planet’s mantle, we can predict how thick its crust will be and, in turn, whether liquid water and an atmosphere may be present. It’s a more precise way of identifying potential new Earth-like worlds than relying on their position in the habitable zone alone.
Measuring the amount of iron in the mantle of a distant planet isn’t something we can do today, but it may be possible in the future. JWST should open the door to exploring the chemistry of alien worlds. Here is to hoping that that much-delayed telescope someday flies and functions.
One thing that always gets me about astronomy is that, with the proper technology, it is easier to observe planets orbiting other stars than to understand the effects of dust and magnetic fields on how we see and what we see beyond our galaxy. To be fair, it could just be that we already have the right telescopes to see alien planets, but we’re only beginning to develop the tools to effectively study things like magnetic fields.
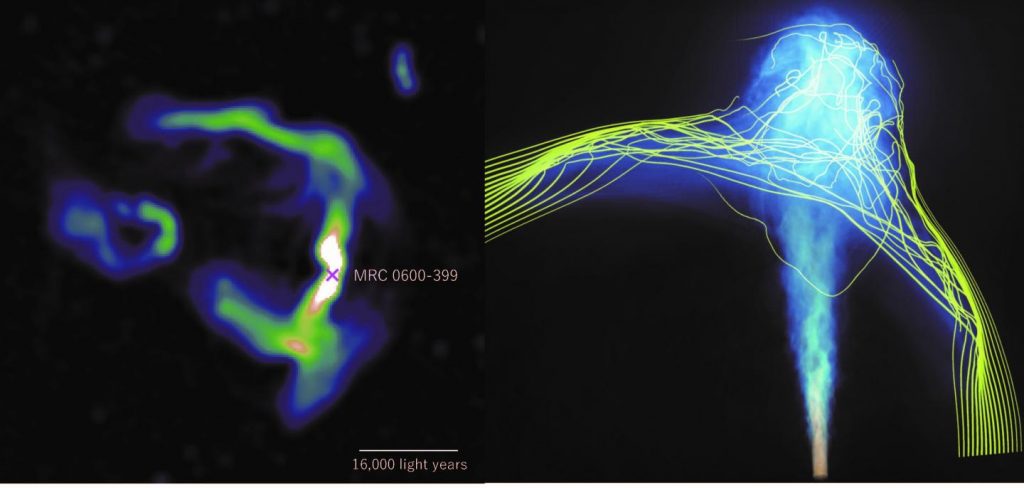
This possibility is hinted at by new work led by James Chibueze that uses the MeerKAT radio telescope to look at a bright galaxy named MRC 0600-399 that is 600 million light-years away in the merging galaxy cluster Abell 3376. This system has an active black hole in its core, and as material streams toward that black hole, it generates powerful magnetic fields that shoot particles out in jets like railguns. Radio telescopes, like the relatively new MeerKAT observatory in South Africa, can see these jets, and in new observations, they reveal the jet mashing into the boundary between this galaxy’s subcluster and the greater galaxy cluster beyond.
Simulations by co-author Haruja Sakemi reveal that what they are seeing is in good agreement with models of interacting magnetic fields at the boundary of the subcluster and cluster. This arching magnetic field bends the jets, creating dramatic scythe-shaped structures. MeerKAT is a precursor system to the planned Square Kilometre Array (SKA), and with that future tool, maybe understanding magnetic fields will get a bit easier.
As much as we may know about our universe, there is even more that we know that we don’t know than. Gamma-ray bursts, the random flashes of some distant something we think are associated with supernovae, fall into the category of things we know we don’t fully understand, and every piece of data we can get is welcomed gladly.

As Pamela has experienced, if you’re using a telescope that might be able to see the optical counterpoint to a gamma-ray burst, you may get asked to stop what you’re doing and move the telescope to look for that brief optical afterglow. For one telescope, however, no repointing was required. The Transiting Exoplanet Survey Satellite (TESS) spacecraft just happened to be looking for planets in the part of the sky where a distant gamma-ray burst was spotted by the Swift-BAT satellite. Normally, this telescope can look for afterglows on its own, but with its super-wide field of view and a photobombing Moon, this time, it couldn’t.
The lucky coincidence that TESS and its smaller field of view were looking at just the right place meant that data was collected. The optical afterglow was at its brightest 1000-2600 seconds after the gamma rays were spotted, and within 7000 seconds, the glow had faded beyond TESS’s ability to see it. We don’t yet know what new science may have been learned, but this is such a cool coincidence, we had to share.
Telescopes like Swift and TESS do their jobs by systematically surveying the sky, over and over and over, looking for things that change. Their repeating series of images means we can easily see when something flickers or flares in the night, and we can go back and see what was there prior to the flash.
TESS and Swift are just two of myriad survey scopes out there, looking through large sections of the sky each night or each orbit, as astronomers look for supernovae, asteroids, and other rare events like microlensed starlight. Anytime you notice a lot of comets with similar names, like NEOWISE, ATLAS, or Pan-STARRS, what you’re hearing are the names of survey scopes that happen to find new comets at a regular cadence.
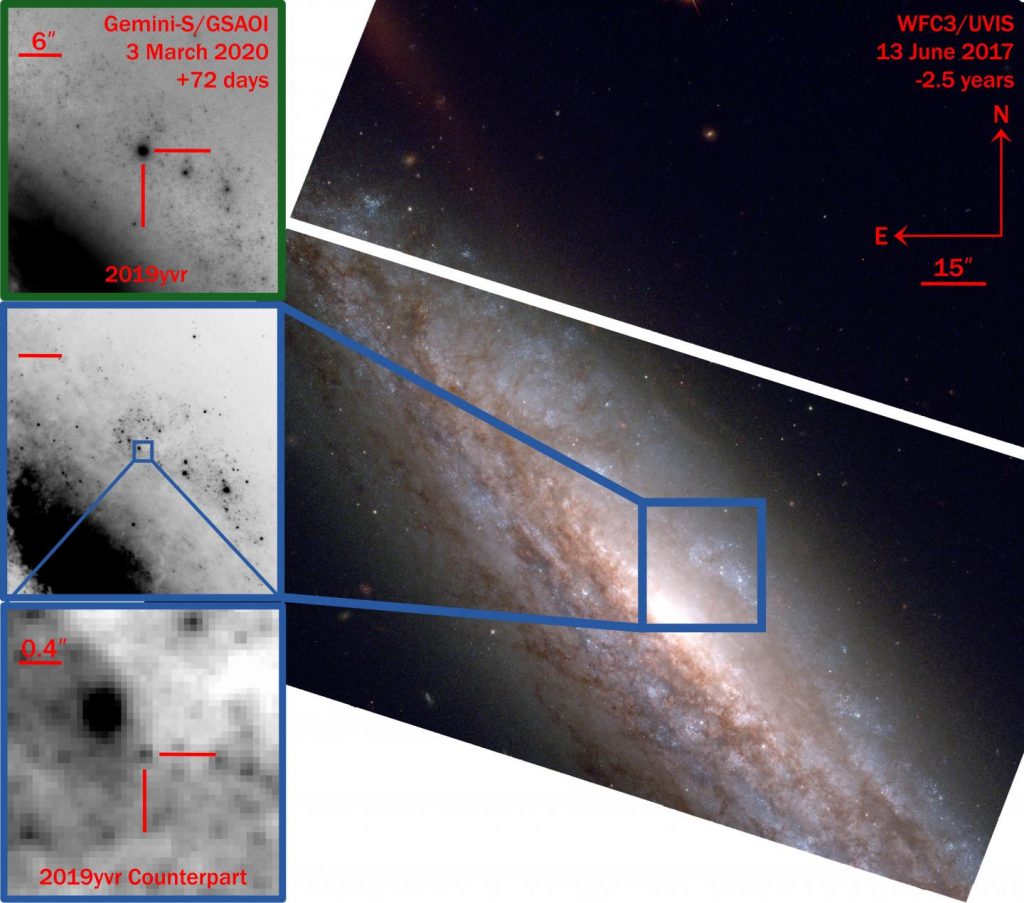
The Pan-STARRS telescope on Haleakalā in Hawaii is used by a number of different surveys, including the Young Supernova Experiment that works to catch the first light of relatively nearby exploding stars. In 2019, it spotted one such explosion in the spiral galaxy NGC 4666. This galaxy is a regular target for both professional and amateur astronomers, and it turned out that not only was their survey data on this object, but for unrelated reasons, the Hubble Space Telescope had observed the location of this supernova, named 2019yvr, 2.5 years prior to its explosion.
These images provided astronomers the rare chance to study exactly how a star looks prior to its explosion. In this case, the star they observed was a yellow star that should not produce the kind of a supernova they observed. Which is perplexing.
Basically, supernova 2019yvr was observed to be a perfectly normal, hydrogen-free supernova. The Hubble images, taken just 2.5 years before the star’s explosion, however, show a yellow star, which means the star had a hydrogen outer layer. So where did the hydrogen go?
This work appears in Monthly Notices of the Royal Astronomical Society (MNRAS) and is led by Charles Kilpatrick, who explains: If a star explodes without hydrogen, it should be extremely blue — really, really hot. It’s almost impossible for a star to be this cool without having hydrogen in its outer layer. We looked at every single stellar model that could explain a star like this, and every single model requires that the star had hydrogen, which, from its supernova, we know it did not. It stretches what’s physically possible.
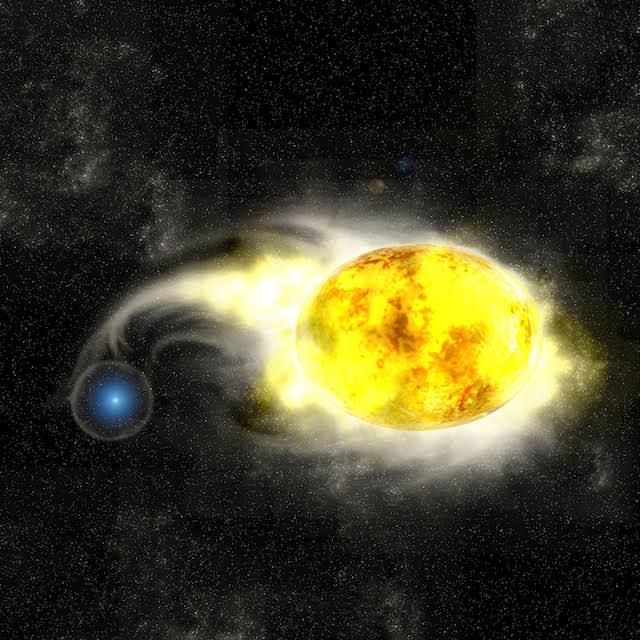
So again we ask, where did the hydrogen go? According to the press release: Several months after the explosion, however, Kilpatrick and his team discovered that the material ejected in the star’s final explosion seemed to collide with a large mass of hydrogen. This led the team to hypothesize that the progenitor star might have expelled the hydrogen within a few years before its death.
Kilpatrick goes on to further explain: Astronomers have suspected that stars undergo violent eruptions or death throes in the years before we see supernovae. This star’s discovery provides some of the most direct evidence ever found that stars experience catastrophic eruptions, which cause them to lose mass before an explosion.”
One additional possible explanation also exists. It could be there is an invisible, hydrogen-thieving, companion star involved, a star that stole the hydrogen in the couple years before the supernova and after the Hubble image. Maybe. We don’t know for sure, but as astronomers like Kilpatrick watch the supernova evolve, we may be able to figure it out in the next few years. When we know more, we’ll bring it to you here on the Daily Space.
We are, as everyone knows by now, huge volcano stans. And the last month has been amazing for all the volcano watchers around the world. We have had our fill of lava pouring out of a cinder cone and fissure in Iceland, as well as some scarier, explosive eruptions at La Soufriere in the Caribbean. But we’re not the only ones keeping an eye on volcanoes these days, and no, I’m not talking about all the webcams around the world. I’m talking about the Volcanic Cloud Analysis Toolkit or VOLCAT.
VOLCAT is a complex set of software that scientists use to process data from remote sensing satellites in near-real-time, and with that software, they can detect and track the volcanic ash clouds that rise up into the atmosphere. For the most part, this analysis lends itself to mitigating ash-related hazards for aircraft, since the ash particles will destroy engines, so planes need to be redirected around the ash clouds.
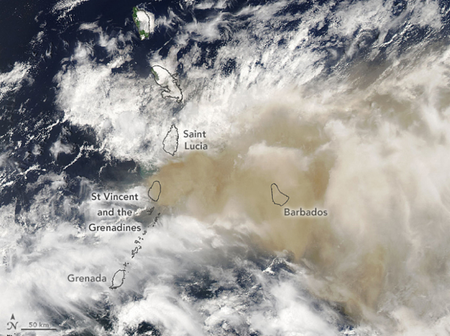
The VOLCAT software was the brainchild of NOAA scientist Mike Pavolonis, who has spent his career watching clouds, and he realized about fifteen years ago that analysts could not integrate all of the data coming in. And now, his project uses five low Earth orbit satellites and four geostationary satellites to track more than 1,500 volcanoes around the world. The satellites have amazing sensors that help identify the radiation signatures specific to ash separate from regular, water-rich clouds. But it’s not always that easy to differentiate the two types of cloud. As Pavolonis explains: …they’re a mixture of volcanic ash, ice, liquid water, and volcanic gases.
When there is no clear distinction between ash cloud and water cloud, VOLCAT tracks the cooling speed of the clouds instead. A volcanic eruption, and this should not come as a surprise, is very hot. And the ash clouds are also hot and get injected by the eruption in the cold upper levels of the atmosphere, and those clouds then cool rapidly compared to thunderstorm clouds. That’s where the geostationary satellites come in as they can stay focused on a single swath of our planet and track the changes over time, observing volcanoes in their surveillance region every fifteen minutes or so. In fact, they can take those images even more often, and La Soufriere was being imaged every minute during the height of its recent eruption.
Of course, VOLCAT is only one piece of the volcano observing puzzle. We still need human experts to filter through the alerts from the system and check for any false notifications. It turns out that it’s hard for even an automated system to process more than a terabyte of data per day. VOLCAT, however, makes it much easier for scientists to focus on where the ash clouds might be, and this means those one-minute images become alerts in less than two minutes. Pavolonis sums up the advancement: We are in a golden era because it was only less than 10 years ago [that] we were happy to get an image every 15 minutes. We [imaged Soufrière St. Vincent’s] clouds when they were on their way up [and] that type of capability is really important.
It’s amazing how quickly technology can improve.
What’s Up
For you morning people out there, right now the Moon is rising as a narrow crescent just before the dawn. Every day until May 11, it will rise a little closer to sunrise and will appear ever so much thinner. This means now is your chance to really enjoy looking at faint things like the band of the Milky Way as it stretches across the sky.
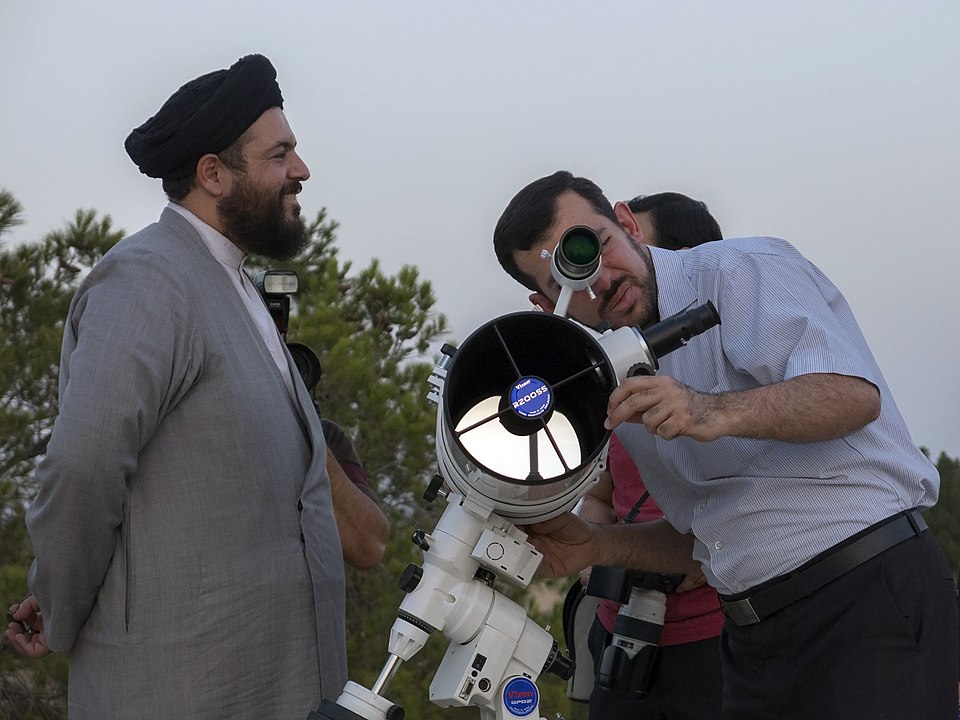
For those celebrating Ramadan, this tiny sliver of the Moon means Ramadan is almost over. Next Tuesday, at 3:01 pm Eastern time, the Moon will be located on the same plane as the Sun and the Earth, and we will be unable to see it in the sky. As it orbits, it will slowly begin to be illuminated on its other edge, as seen from Earth, and once the illuminated edge is seen, Ramadan will end. This means observatories across the Muslim world will be watching closely for that hour’s old moon to be visible.
For people of all cultures, the race to see just how young a new moon can be spotted to the west of the Sun is an astronomical challenge worth accepting. To see it, you have to point your telescope during the day at the spot the Moon should be located and make out the faint crescent against the bright blue sky. I personally have never seen a Moon younger than a day, but in 2002, Mohsen Mirsaeed spotted an 11-hour, 40-minute old Moon on Sept 7, 2002, using binoculars, setting a new record.
Observing the Moon is something we do for many reasons. It’s there and it’s pretty is a perfectly sound reason and is part of why I like trying to photograph the Moon against the horizon. The Moon is also scientifically interesting as it formed, we think, through the collision of the Earth and another object we call Theia. The thud created a dense Earth, and the splash created the lower density moon.
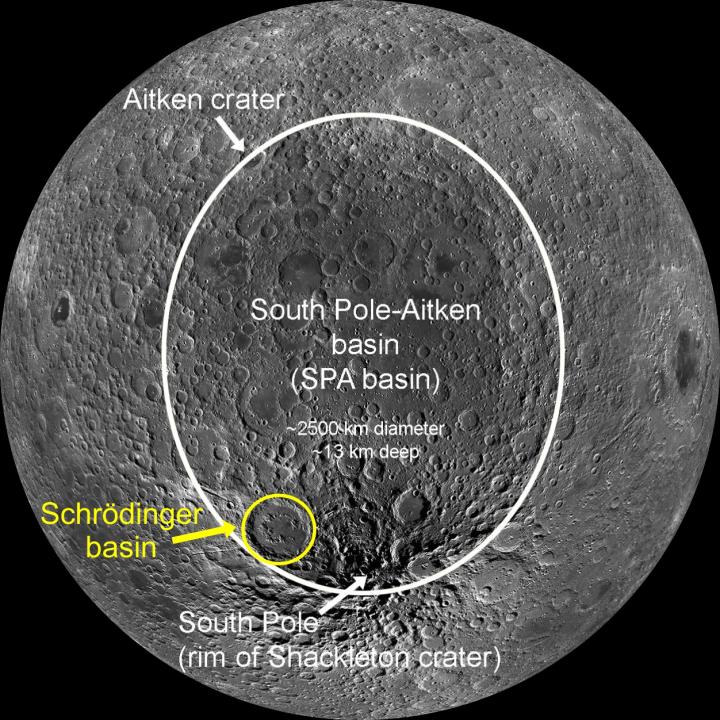
To better understand exactly what happened, we really want to explore all the different kinds of minerals the Moon has, and because asteroids have hit the moon many times, we know some of the minerals from its interior have been tossed onto its surface. Ideally, we want to get our hands on these free samples from deep in the Moon, and we want the freshest samples we can get. This means, sending rovers or humans to the Schrödinger Basin, the youngest basin on the Moon.
In preparation for future exploration, Ellen Czaplinski and a team of students poured over lunar images of the lunar south pole’s Aiken Crater and the Schrödinger Basin to map the minerals we most want to sample and understand. According to Czaplinski: When the Schrödinger basin was formed, some of these lithologies (the general physical characteristics of the rocks) may have been uplifted from very deep below the lunar surface. … Many of these rock types are exposed at the surface in multi-kilometer long exposures of rock outcrops in Schrödinger’s ‘peak ring,’ an inner ring of uplifted rocks that formed with the basin.
Along with mapping the minerals, the team also mapped out three potential paths for future rovers, or maybe even humans, to explore. Now with these maps in hand, we just need to land more robotic or biologic explorers on the Moon.
This has been the Daily Space.
Learn More
Very Large Array Observations Reveal Changes Over Time of Stellar Nursery
- NRAO press release
- “Time-variable Radio Recombination Line Emission in W49A,” C. G. De Pree et al., 2020 October 29, The Astronomical Journal
Core Formation Method Useful For Determining Habitability
- UBCO press release
- “The effect of core formation on surface composition and planetary habitability,” Brendan Dyck, Jon Wade, and Richard Palin, to be published in The Astrophysical Journal Letters (preprint on arxiv.org)
Magnetic Fields Wildly Reshape Jets From the Cores of Galaxies
- NAOJ press release
- “Jets from MRC 0600-399 bent by magnetic fields in the cluster Abell 3376,” James O. Chibueze et al., 2021 May 5, Nature
TESS Accidentally Takes Picture of Rare Gamma-Ray Burst
- Southern Methodist University press release
- “GRB 191016A: A Long Gamma-Ray Burst Detected by TESS,” Krista Lynne Smith et al., 2021 April 14, The Astrophysical Journal
Strange Supernova Appears Cool Before Exploding
- Northwestern press release
- RAS press release
- “A cool and inflated progenitor candidate for the Type Ib supernova 2019yvr at 2.6 yr before explosion,” Charles D Kilpatrick et al., 2021 March 30, Monthly Notices of the Royal Astronomical Society
VOLCAT Keeps an Eye on Ash Clouds
- Eos article
What’s Up: The Crescent Moon and New Lunar Maps
- Great chance to spot a very young moon April 12 (EarthSky)
- Waxing Crescent Moon (timeanddate)
- University of Arkansas press release
- “Human-assisted Sample Return Mission at the Schrödinger Basin, Lunar Far Side, Using a New Geologic Map and Rover Traverses,” E. C. Czaplinski et al., 2021 March 12, The Planetary Science Journal
Credits
Written by Pamela Gay and Beth Johnson
Hosted by Pamela Gay and Beth Johnson
Audio and Video Editing by Ally Pelphrey
Content Editing by Beth Johnson
Intro and Outro music by Kevin MacLeod, https://incompetech.com/music/


 We record most shows live, on Twitch. Follow us today to get alerts when we go live.