
Stellar formation and evolution data collected from ESA’s Gaia telescope has allowed scientists to create a timeline of the evolution of our own galaxy, the Milky Way. Plus, an ancient ice age, sound on Mars, a new exoplanet, and What’s Up.
Podcast

Show Notes
Tiny fossils support ancient ice age
- University of Copenhagen press release
- “A Baltic Perspective on the Early to Early Late Ordovician δ13C and δ18O Records and Its Paleoenvironmental Significance,” Oluwaseun Edward et al., 2022 February 22, Paleoceanography and Paleoclimatology
Percy helps calculate speed of sound on Mars
- Analysis of sounds captured by Perseverance rover reveals speed of sound on the Red Planet (Phys.org)
A new, distant, fluffy exo-Jupiter is found
- New Jupiter-sized exoplanet discovered with TESS (Phys.org)
- “TOI-3757 b: A low density gas giant orbiting a solar-metallicity M dwarf,” Shubham Kanodia et al., submitted to AAS journals (preprint on arxiv.org)
Gaia dates galaxy evolution
- ESA press release
- “A time-resolved picture of our Milky Way’s early formation history,” Maosheng Xiang & Hans-Walter Rix, 2022 March 23, Nature
- Here’s the best timeline yet for the Milky Way’s big events (Science News)
What’s Up: CAMALIOT app
- ESA press release
- The Sky This Week: The Moon passes the planets (Astronomy)
Transcript
Today, I get to talk about one of my favorite telescopes, ESA’s Gaia, and how it has helped us understand the evolution of the Milky Way.
And I get to talk about ESA’s new app for citizen science that will help with weather forecasting.
Plus, we uncover an ancient ice age using tiny fossils, Perseverance analyzes sound on Mars, and TESS discovers a Jupiter-like exoplanet.
All of this and more is coming at you, right here on the Daily Space.
I am your host Dr. Pamela Gay.
And I am your host Erik Madaus.
And we’re here to put science in your brain.
Our first segment today is a bit of a grab bag of planetary science. Let’s begin here on Earth.
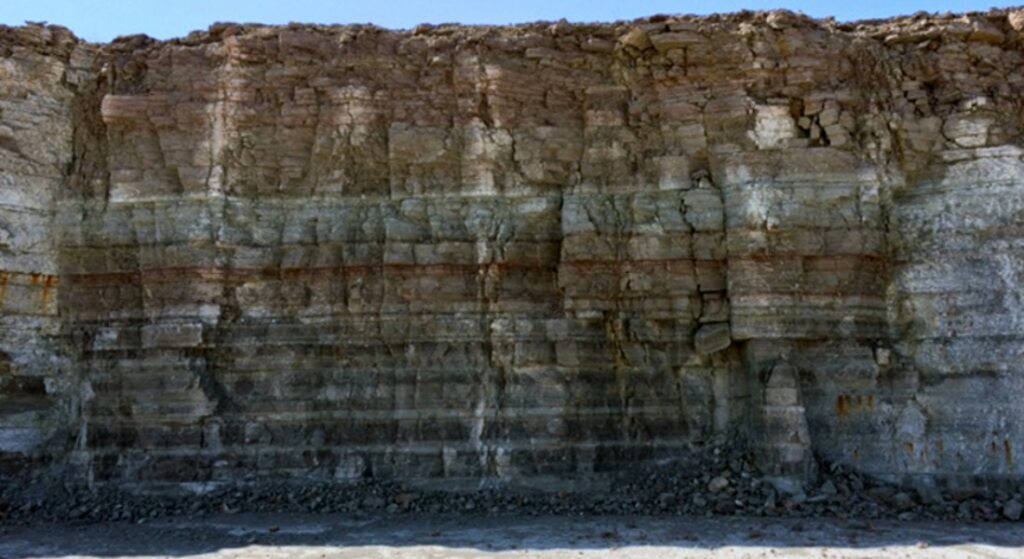
About 470 million years ago, Earth was in a period known as the Middle Ordovician, during which occurred an explosion of biodiversity never seen before or since. Scientists have long hypothesized that the reason for this massive increase in forms of life has to do with an ancient ice age that started about the same time. Life likes it when the planet cools down a bit, and Earth becoming a bit of an icehouse apparently helped nudge evolution along. But the evidence for this ancient ice age has been indirect.
You see, the planet didn’t look the way it does now. Continents were in different places, water levels weren’t the same. In fact, what is now the South Pole was where today’s north-western Africa is now. And with everything moving around and being buried under a polar ice cap, we haven’t found physical evidence of glacial deposits or even sedimentary features that can help us state for certain, “Yes, we entered an ice age right here.”
So scientists have focused on fossil evidence, which can indirectly reveal changes in ocean temperatures, and on oxygen isotopes, which also show changes in climate. In a new paper published in Paleoceanography & Paleoclimatology, scientists managed to combine both of these techniques by looking at the oxygen isotopes found in calcite crystals in the interior of fossils. They had to use crystals from the interior of the skeletons because oxygen is easily altered in rocks. Lead author Christian Mac Ørum explains: To minimize the effects of diagenesis we have carefully extracted crystals of the mineral calcite from the interior of fossil brachiopods which – much like bi-valves are today – were abundant and diverse during the Ordovician where they lived on the seafloor, filtering seawater for nutrients.
It’s a tedious process, and the team performed it hundreds of times on samples from a Swedish island in order to increase the resolution of the data. Color me impressed. That is a lot of work for one project.
As for the results, they added to the mounting indirect evidence for that ancient ice age. Mac Ørum further explains: With this new study, albeit still indirect evidence, we have now reached a stage where we are beginning to see distinct shorter, unstable pulses of ice sheet growth followed by longer, more stable, colder phases which correspond to increases in continental ice sheet growth. This is exactly the scenario we would expect based on evidence from the last ice age.
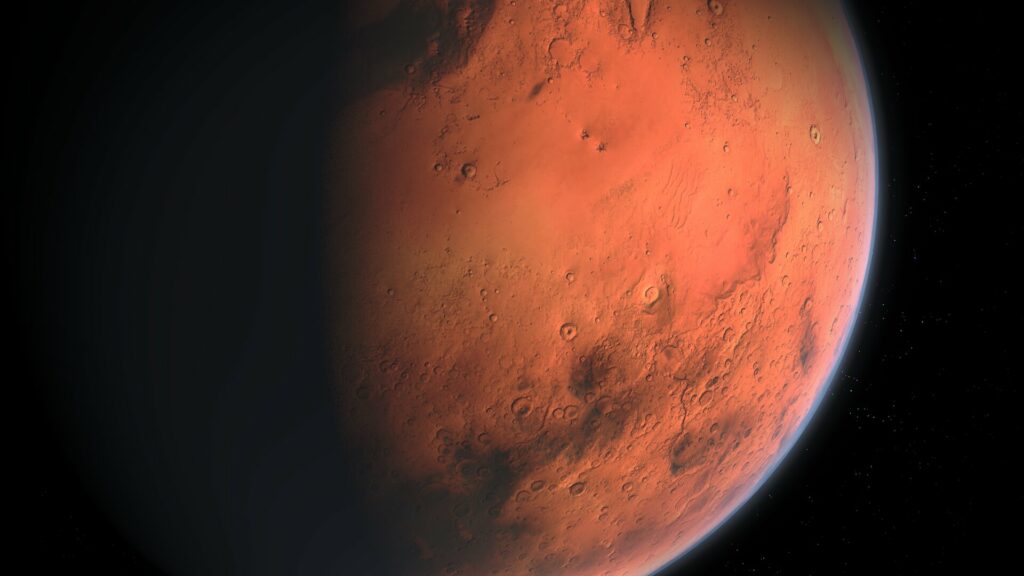
Moving further out into our solar system, NASA’s Perseverance Rover, with its fantastic microphone, has collected enough data to allow researchers to calculate the speed of sound on Mars. Baptiste Chide presented the findings during this year’s Lunar and Planetary Science Conference.
The method used was extremely simple and kind of brilliant. They measured the amount of time it took for the sounds of Percy’s laser blasts as it sampled rocks to return to the microphone on the rover. Since they knew the distance from the ground to the microphone, they could calculate the velocity of the sounds. It’s a pretty basic physics problem where velocity equals distance divided by time.
And the answer? The speed of sound on Mars is approximately 240 meters per second. But wait, there’s more. Different frequencies seem to travel at different speeds, with an increase of 10 m/s occurring for sounds above 400 Hz. That could make communication with people on Mars very difficult since certain sounds of speech would arrive at different times and leave the conversation garbled.
Side note! The speed of sound is also sensitive to temperature, so Percy’s microphone can be used to measure changes in temperature around the rover. Pretty cool stuff.
Chide and his team plan to continue analyzing the sounds coming from Mars in order to determine any seasonal changes or other fluctuations such as might occur during a dust storm. We’ll bring the results to you here on Daily Space when they publish them.
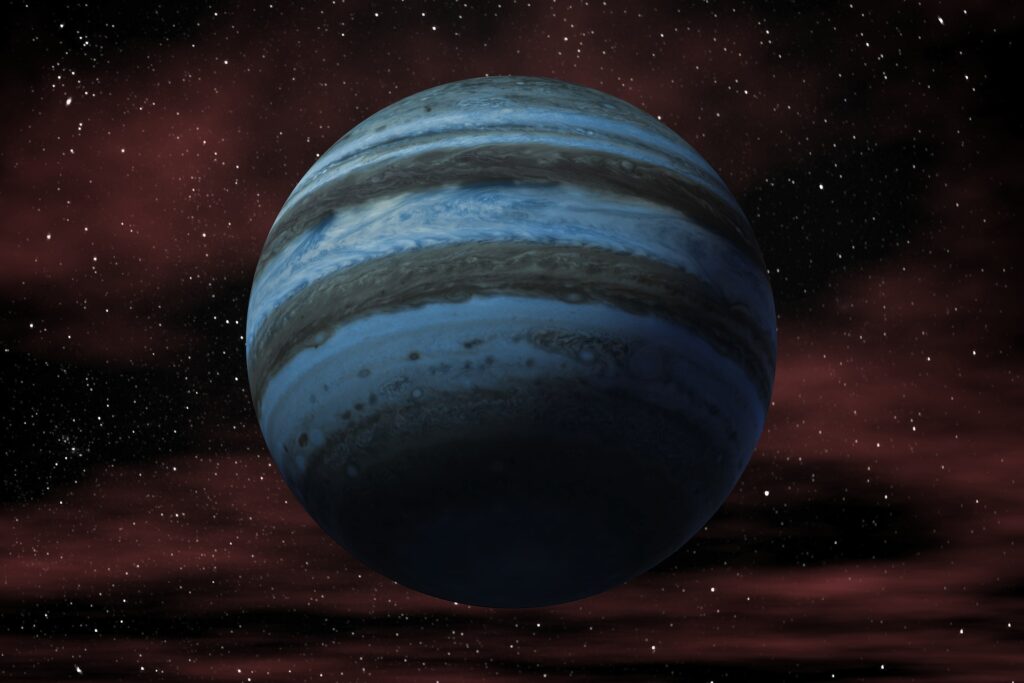
Finally, we’re going to look outside our solar system at a new planet discovered in TESS data. As always, these reported discoveries always have something strange or interesting involved since “wow, we discovered an exoplanet” just isn’t cutting it anymore, what with 5,000 confirmed ones out there in the galaxy.
This particular discovery involves a planet, TOI-3757 b, about the size of Jupiter, at 1.09 Jupiter radii. Not very interesting, right? Where this one gets weird is the mass calculation; it’s only 0.268 Jupiter masses, making it very fluffy with a density of only 0.27 grams per cubic centimeter. And it’s a close-in, hot ball of fluff, orbiting its star in just 3.44 days at a very close distance of 0.038 AU or less than 6 million kilometers.
The parent star, TOI-3757, is an M dwarf, which makes it smaller and less massive than our Sun. It’s about 600 light-years away, 7.1 billion years old, and has an effective temperature of 3900 Kelvin. Intriguingly, the stellar metallicity for this star is the lowest of any M dwarf that has known gas giant planets.
And that low metallicity could be the reason TOI-3757 b has such a low density. Without a lot of metals to pull from in the protoplanetary disk, the accretion of all the gas may have been delayed and cut short. The low density could also be the result of the planet’s slightly eccentric orbit, which may have led to an inflation of the gases as a result of tidal heating differentiations.
Knowing astronomy, it’s both.
And now, I get to talk about that favorite mission, ESA’s Gaia telescope, and the evolution of the Milky Way.
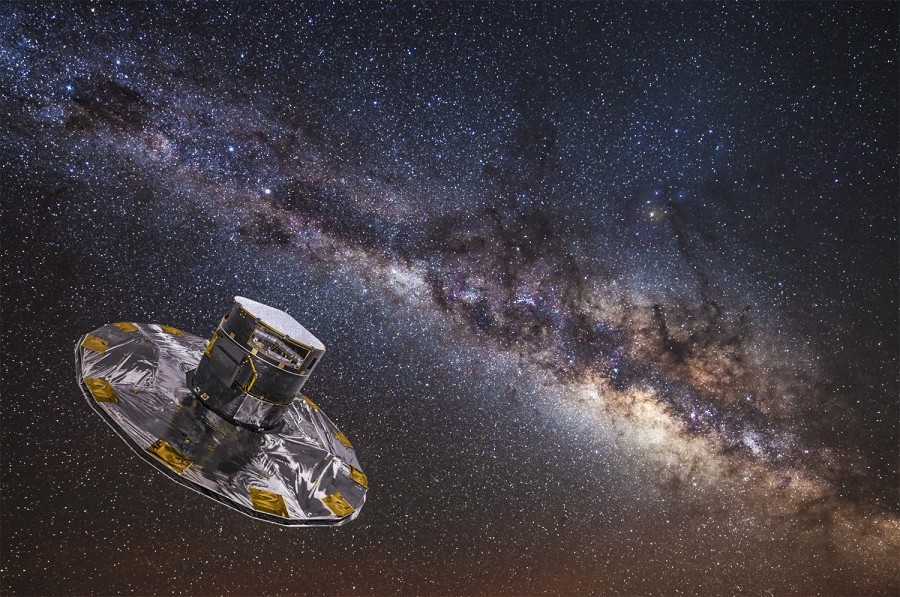
One of the things we don’t do often enough is talk about why some of the lesser-known space telescopes are so awesome. Today, I’m going to take a moment to talk about the European Space Agency’s Gaia mission.
Launched in 2013, this telescope has a purpose-built design that is like no other telescope. Instead of a standard round mirror, it has a series of curved rectangular mirrors that allow it to accomplish a variety of different tasks simultaneously. Those tasks? Gaia is designed to catalog with great accuracy the positions, motions, and colors of known objects of interest — one billion known objects of interest. That may sound like pretty standard stuff, but the how of it is technological wizardry of the highest level.
Here is what is going on: Gaia is slowly spinning, and as it spins, its mirrors are collecting light coming in from the sides of the telescope, perpendicular to that access of rotation. Yes, the telescope with the rectangular mirror is looking out through the sides of its tube while spinning. This slow spin causes the light it is detecting to drift across its detectors over time. Unlike your standard digital camera that collects all the light from a single point in a single set up pixels and then reads out the image one column at a time after it finishes collecting the light, Gaia constantly reads out the image, one column at a time, while the image drifts across the detector at the same rate that the detector is being read out. This means an object’s exposure time is equal to the amount of time it takes to read out the entire detector. It’s kind of weird, and it totally works, which makes it really wonderful.
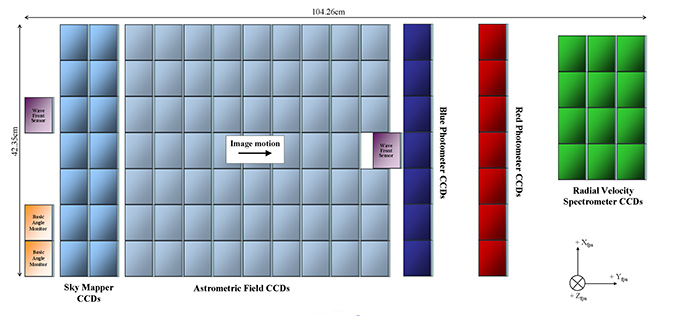
This kind of drift-scan technique also means that they can slowly move the light from entering one kind of detector to another. Initially, the mirrors will send an object’s light onto its sky mapper detector that checks for rapid variations and confirm that what is being seen is an object and not a cosmic ray or other mistake. From the sky mapper, the light path shifts onto the astrometric field detector; this is the highest resolution camera sent into space and is precise enough to measure how the position of stars changes due to planets going around them.
From here, the light is measured in shades of blue and shades of red, and finally, some of the light is put through a spectrometer that measures the chemistry of the light source and its velocity toward or away from us. This amazing system allows us to actually get the three-dimensional motion of objects as the astrometric system sees their N-S-E-W motions, and the spectra get that last toward and away motion.
And because Gaia is traveling alongside the Earth and Moon in our orbit around the Sun, its change of perspective allows it to also catch the slight changes in where a star appears that are due to our own change of perspective.
To understand what I mean, close one eye and block some distant object with your finger. Now switch which eye is open. You’ll see your finger appear to jump, and the amount it jumps will change depending on how far from your face you hold your finger. If you call your left eye June and your right eye December, you can imagine you are seeing how nearby stars appear to move compared to distant galaxies as the telescope moves from one side of the Sun to the other. This means that Gaia has not only the three-dimensional motions of stars but also their positions, and since this is a multi-year mission, it gets to watch as those positions actually change with their motions over time.
This system is my favorite of all astronomical systems.
And we have new and amazing science from this system today. Science that is so much more awesome when you know more about how it was detected.
Now eight years into its mission, Gaia has had the chance to visit the same stars over and over, improving its data and refining our understanding of stars’ positions, motions, compositions, surface gravities, and more, and with one billion stars to study in a large sphere around our position in a galactic arm, this allows researchers to ask super focused questions and get high-quality answers.
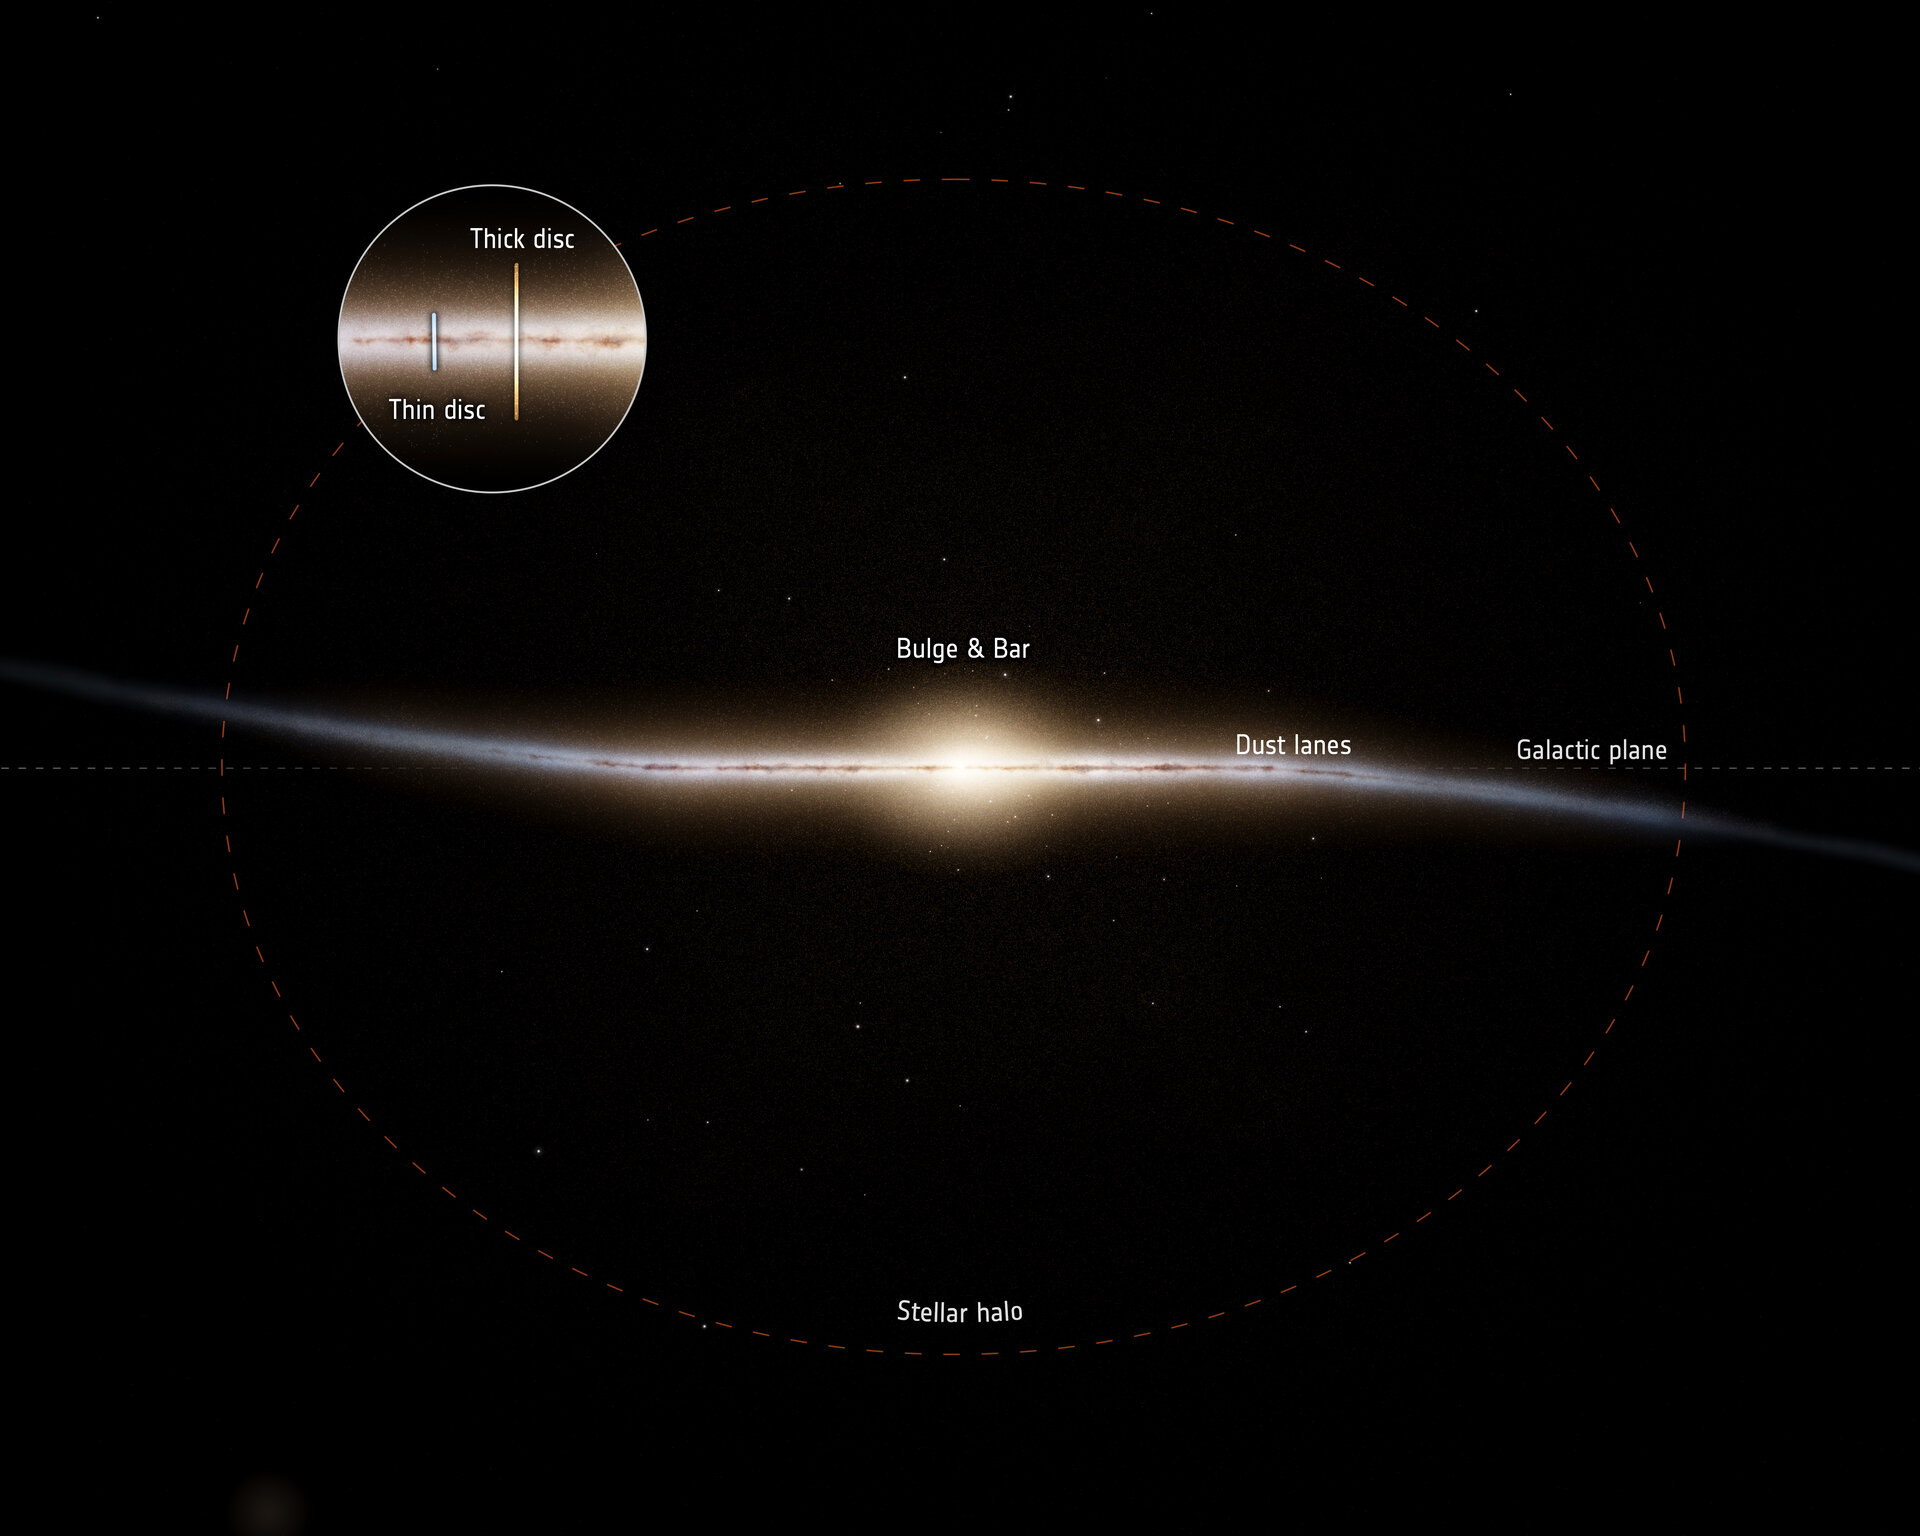
A newly published analysis of 250,000 stars found that the outer parts of our galaxy’s disk – essentially its top and bottom surfaces – were older than we knew. This region is called the galactic thick disk.
Models of stellar evolution allow us to know how long certain parts of a star’s life should last, and when we see stars of a given type, we can estimate their age as being the duration of all earlier parts of their life, up to the age of the next stage of their life. This is like looking at a child that has taken its first step and knowing it has completed the learning to hold up its head, learning to roll over, and other prior steps, and should be about twelve months old.
The shorter the duration of any stage, the more accurately we can know the star’s age. And conveniently, the bright sub-giant stage of stellar evolution is just such a stage.
In a new paper from Maosheng Xiang and Hans-Walter Rix that appears in Nature, they use Gaia data, along with data from China’s Large Sky Area Multi-Object Fiber Spectroscopic Telescope. According to Maosheng: With Gaia’s brightness data, we are able to determine the age of a subgiant star to a few percent.
And since subgiants with different masses and different chemistry all have different ages, much like an adult mouse and an adult human are very different ages, they were able to put together a timeline for the formation and evolution of our galaxy.
Roughly 800 million years after the Big Bang, the first stars in our galaxy started forming. Initially made of hydrogen, helium, and only a tenth of the iron of our Sun, each new generation of stars fused these atoms together to build up the atomically diverse galaxy we live in today. In fact, the last stars formed in this region were three times richer in iron than our Sun.
Stars didn’t form at a continuous rate, with the same number of stars forming year after year. Instead, about eleven billion years ago, a massive burst of star formation was triggered when the ill-named Gaia-Sausage-Enceladus galaxy collided with the early Milky Way. This collision shocked clouds of gas into star formation splashed stars into the galaxy’s outer sphere of stars, and this burst was able to use up the thick disk’s gas in just three billion years. Ziang says: The Milky Way has been quite quiet for the last eight billion years.
If it continues to come together successfully, the JWST will have the capacity to be able to see galaxies similar to our own forming in the past. If this happens — can we say “when this happens”, yet? When/if this happens, we’ll bring you those images right here on the Daily Space.
Next up, we’re joined by Erik Madaus and our weekly What’s Up segment.
What’s Up
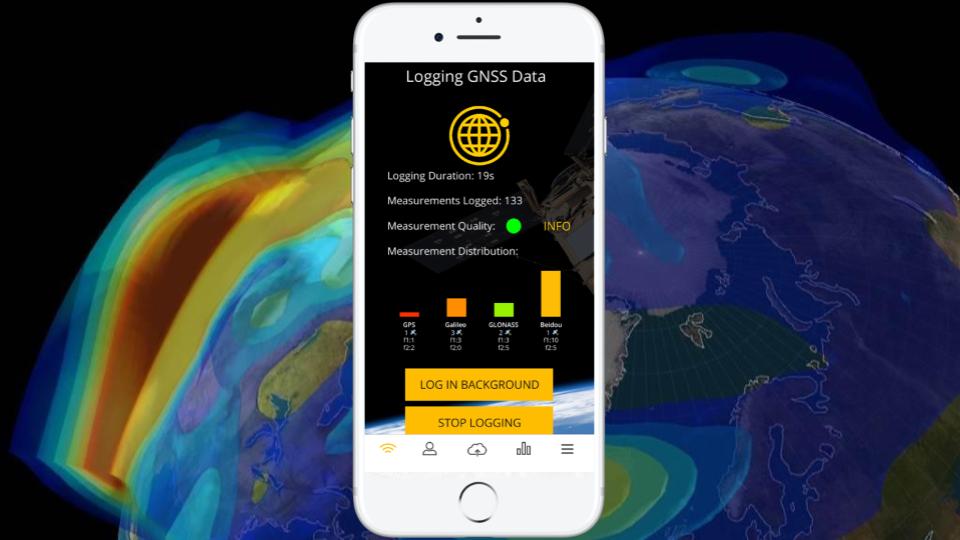
This week in What’s Up: how you can help the European Space Agency with your Android smartphone. ESA’s Navigation Innovation and Support Program has an app called CAMALIOT with which you can help scientists improve weather forecasting models and predictions of space weather, such as the types of events that can disrupt our communication systems due to solar flares.
All you need to do is leave your phone by the window each night with positioning turned on so that the phone can “record small variations” in the signals from GPS satellites. Since the signals can be affected by atmospheric conditions such as the amount of water vapor in the atmosphere and space weather events, it’s possible to use these small differences to make inferences about the atmospheric conditions.
Basically, the CAMALIOT app records the GPS signal data and sends that information and the location of the phone to the researchers. They in turn use that data with machine learning algorithms to improve weather forecasting, particularly for rainfall.
The app is available for fifty different models of Android smartphones and can be downloaded from the Google Play store. We’ll include a link to the CAMALIOT website in our show notes for this episode on DailySpace.org.
This segment is called What’s Up but so far, this segment has been about what you can do not what you can see in the night sky. Let’s change that.
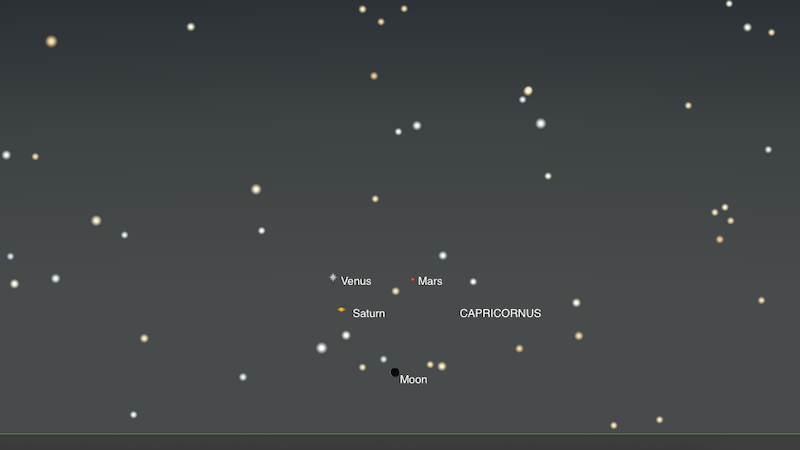
Coming up starting the evening of March 27 around midnight and continuing into the wee hours of the 28th is a series of conjunctions involving Saturn, Venus, and Mars, which will all be between 2 and 7 degrees of the Moon.
On Friday, April 1, there will be a New Moon, which would be a good time to head out with your binoculars or telescope and try to observe some of the fainter objects in the night sky. If you want a challenge, try observing the open clusters M46 and M47 in the constellation Puppis. We’ll have a finder chart also in our show notes.
This has been the Daily Space.
You can find more information on all our stories, including images, at DailySpace.org. As always, we’re here thanks to the donations of people like you. If you like our content, please consider joining our Patreon at Patreon.com/CosmoQuestX.
Credits
Written by Pamela Gay, Beth Johnson, Erik Madaus, and Gordon Dewis
Hosted by Pamela Gay, Beth Johnson, and Erik Madaus
Audio and Video Editing by Ally Pelphrey
Content Editing by Beth Johnson
Intro and Outro music by Kevin MacLeod, https://incompetech.com/music/
 We record most shows live, on Twitch. Follow us today to get alerts when we go live.