
A team of scientists collected cores and modeled ice cliff failure and found that Thwaites Glacier in Antarctica is melting more quickly than ever and could be at risk of collapse, threatening global coastlines with almost a meter of sea-level rise. Plus, new results from Percy, and this week’s What’s Up.
Podcast

Show Notes
Parker Solar Probe touches Sun’s atmosphere
- NASA press release
- “Parker Solar Probe Enters the Magnetically Dominated Solar Corona,” J. C. Kasper et al., 2021 December 14, Physical Review Letters
Early Venus hit hard by high-speed impacts
- AGU press release
Earth’s magnetosphere creates STEVE
- LASP press release
Percy rides on volcanic rocks
- NASA JPL press release
Massive Thwaites glacier at risk of collapse
- CIRES press release
2022 brings four new Earth science missions
- NASA press release
What’s Up: Christmas Tree Cluster
Transcript
Hello and welcome to the Daily Space. I am your host, Beth Johnson, and I am here to put science in your brain.
Today’s news will take you on a tour of our inner solar system, so let’s get started.

NASA’s Parker Solar Probe is an ambitious spacecraft that seeks to get closer to the Sun than any prior craft. And wow, has it done that. This week, NASA reported that the Parker Solar Probe got within 15 solar radii, or about 10 million kilometers, of the surface of the Sun. That puts the spacecraft within the solar corona, a feat never before accomplished. And the probe answered a long-standing question – how far out does the Alfvén critical surface start?
The Alfvén critical surface is where the solar atmosphere ends and the solar wind begins. Researchers had estimated that this point occurs somewhere between 10 and 20 solar radii from the surface, and on April 28, 2021, the Parker Solar Probe found the correct conditions for this transitional location at 18.8 solar radii or just over 13 million kilometers out from the surface. The results of this finding were published in the Physical Review Letters, and lead author Justin Kasper noted: We were fully expecting that, sooner or later, we would encounter the corona for at least a short duration of time, but it is very exciting that we’ve already reached it.
Additionally, when the Parker Solar Probe reached that 15 solar radii point, it ran across what is known as a pseudostreamer. If you’ve ever looked at photos of a solar eclipse at totality, you’ve seen these streamers coming out of the Sun’s surface from behind the disk of the Moon. The probe discovered that flying through these streamers is similar to flying through the eye of a hurricane – everything quiets down, particles move more slowly, and there are fewer magnetic switchbacks.
The Parker Solar Probe will continue to spiral closer and closer to the Sun, eventually getting as close as 8.86 solar radii. The next flyby happens in January 2022 and will bring the spacecraft through the corona again. We’ll bring you the results of that flyby here on Daily Space.

We now turn from answering questions about the Sun to trying to understand why Venus and Earth ended up such vastly different worlds. After all, they are roughly the same size, mass, and density, and their distances from the Sun aren’t that different. But their atmospheres and plate tectonics are not the same, and that doesn’t even bring into account the weirdly slow rotation of Venus.
In new research presented at the American Geophysical Union’s Fall Meeting, scientists modeled how large, high-speed impacts in our early solar system might have affected Venus differently from Earth. Planetary scientist Simone Marchi explains: Early on, in the beginning of the Solar System, the impactors would have been immense. If an early impactor was larger than, say, a few hundred kilometers in diameter, it could have affected the deep interior of a planet, along with its surface and atmosphere. These colossal collisions would basically affect everything about a planet.
Basically, the higher speed impacts lead to twice as much melting of Venus’ mantle than the impacts that hit Earth. And impacts to Venus that came in at shallow angles would have completely melted the mantle. All that sudden melting affected the mineralogy and structure of the planet, and the atmosphere would have been blasted away for the most part. Then the volatile gases from the interior would have replaced that atmosphere, and suddenly, you have a very different world from Earth.
Thank goodness we have not one, not two, but three missions heading to Venus to help us understand a world we sometimes refer to as Earth’s twin. Sister planets they may be, but they are fraternal twins at best.
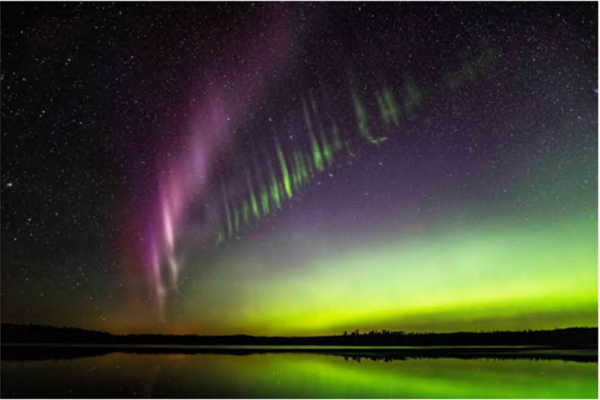
Speaking of Earth, we are not without our unknown phenomena here. And one of our favorites to talk about on the show is STEVE. STEVE is a type of aurora that appears as streaks of purple and green dancing lights. It was named STEVE as a joke, and then someone created the backronym Strong Thermal Emission Velocity Enhancement to make STEVE sound more scientific. We love STEVE.
Anyway, scientists have been trying to understand STEVE for a few years now, and it wasn’t until 2016 that STEVE even had a name. Now researchers from the Laboratory for Atmospheric and Space Physics at the University of Colorado Boulder presented their findings on just where STEVE originates at the AGU Fall Meeting this week. They kind of lucked out on this analysis with the help of citizen scientists who managed to take photographs of the same STEVE event from 400 kilometers apart. With two different angles to work with, the team could triangulate where the bands of color originated, and they came from the magnetosphere.
Lead author Xiangning Chu explains: Our analysis indicates that both the purple and green STEVE emissions are driven by the same, narrow region, so it must be the magnetosphere. This supports our previous study, which provided evidence that STEVE’s driver region is located at a sharp boundary in the magnetosphere that’s marked by strong waves and particle acceleration.
Next up, they hope to figure out what causes STEVE. Again, we’ll bring that result to you here on Daily Space when they find it.
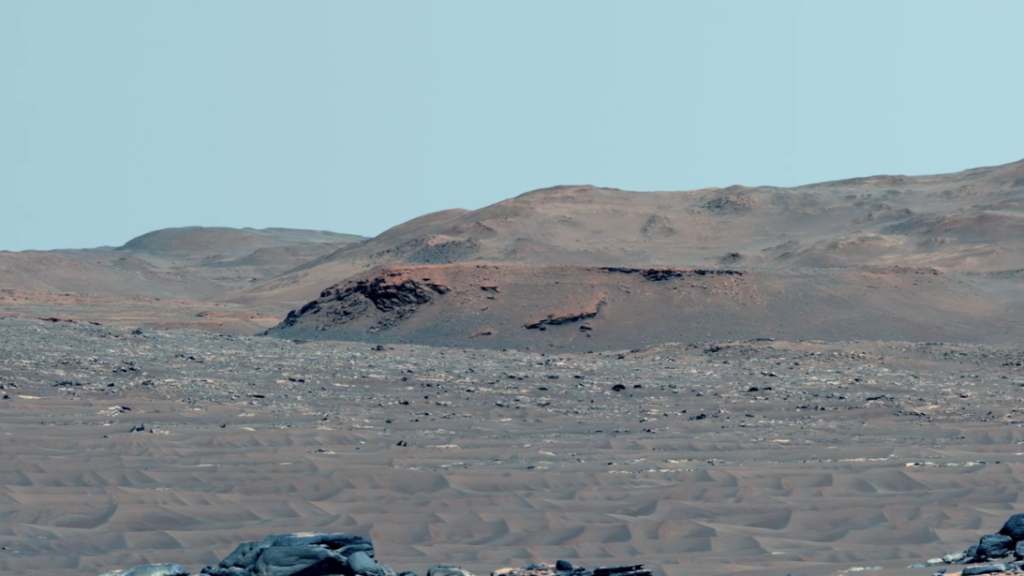
The AGU Fall Meeting is always a great time of year for planetary science. All these results and releases that were being held until the conference come flooding out, and we get to look at tons of neat science. As we continue on our tour of the inner solar system, we come to Mars and a certain newly arrived rover named Perseverance who is rolling around, collecting rocks, and taking samples.
And oh, how we are learning new things about Mars from this rover.
First, it turns out that the rocks under Percy’s six wheels are volcanic in nature. If we date those rocks, we can understand more about Mars’ geologic history, particularly in Jezero Crater, where Percy is exploring.
Second, the science team has found that rocks in the crater have interacted with water more than once and even contain some organic molecules.
These results come from an analysis of rocks sampled by the Planetary Instrument for X-ray Lithochemistry, or PIXL, which uses X-ray fluorescence to determine the elemental composition of the rocks. One particular rock, sampled on November 12 and nicknamed ‘Brac’, turned out to be composed of large olivine crystals surrounded by pyroxene. Project scientist Ken Farley explains why this is important: A good geology student will tell you that such a texture indicates the rock formed when crystals grew and settled in a slowly cooling magma – for example, a thick lava flow, lava lake, or magma chamber. The rock was then altered by water several times, making it a treasure trove that will allow future scientists to date events in Jezero, better understand the period in which water was more common on its surface, and reveal the early history of the planet.
Now they cannot yet tell if these rocks cooled underground or on the surface, but they have been taking samples and have four rock cores so far for that future Mars Sample Return mission to collect.
So what about those organic molecules? Before you get too excited, remember that in scientific terms, ‘organic’ here just means that the molecules contain carbon. These molecules were found by the SHERLOC instrument both in the interiors of rocks and in the dust on top of the rocks. It doesn’t mean there was once life on Mars since organic molecules come from both biological and non-biological mechanisms.
SHERLOC principal investigator Luther Beegle notes: Curiosity also discovered organics at its landing site within Gale Crater. What SHERLOC adds to the story is its capability to map the spatial distribution of organics inside rocks and relate those organics to minerals found there. This helps us understand the environment in which the organics formed. More analysis needs to be done to determine the method of production for the identified organics.
Oh, and I should note one more result from Perseverance presented at the AGU Fall Meeting. Onboard is a ground-penetrating radar called RIMFAX, which has been creating ‘radargrams’ of subsurface features to a depth of about 10 meters. So far, they have found rock formations along a ridgeline that have a visible downward tilt, and that feature continues underground as well. We’re mapping geology under the surface of another planet. How cool is that?
Not all the news from the AGU Fall Meeting is sunshine and roses, though. A major topic of the conference is climate change, and the news there isn’t pretty, as expected.
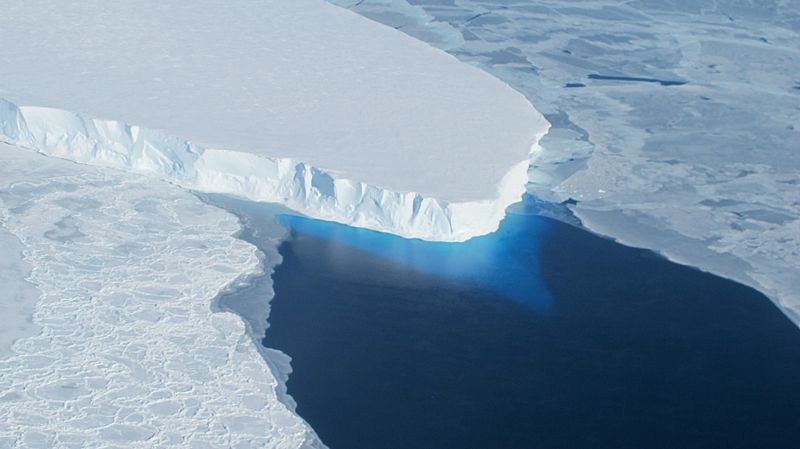
In particular, researchers reported on the situation with the Thwaites glacier in West Antarctica, which has 120 kilometers of frozen coastline slowly flowing into the ocean. That outflow rate is increasing, though. Senior research scientist Ted Scambos from the Cooperative Institute for Research in Environmental Sciences (CIRES) explains: Thwaites is the widest glacier in the world. It’s doubled its outflow speed within the last 30 years, and the glacier in its entirety holds enough water to raise sea level by over two feet. And it could lead to even more sea-level rise, up to 10 feet, if it draws the surrounding glaciers with it.
I don’t even know how to report on this story without being horrified. This glacier is the size of the state of Florida or the country of Britain for you EU folks.
Warmer ocean water is circulating beneath the floating portion of the glacier on the eastern side, and that water is melting the ice from underneath. This melting in turn causes the glacier to lose hold of the underwater mountain anchoring it. There are massive fractures forming, and the floating extension of the Thwaites Glacier is likely to fail in the next few years.
And deep under the ice shelf in the ocean cavity below, water that is warm by polar standards, and is also salty, is creating a chaotic zone of rugged ice and a sloping bottom surface that is melting quickly. Scambos goes on to terrify us further by noting: If Thwaites were to collapse, it would drag most of West Antarctica’s ice with it.
We need to get a handle on climate change sooner rather than later. Lives literally depend on it. I wish I was being overly dramatic, but I’m not.
While some scientists are tackling glacial changes from the ground, NASA is taking to space with four new Earth science missions to monitor climate change from above. All four of these missions are scheduled to launch in 2022, and since Pamela isn’t here, let’s take a look at each one. Keep in mind, there are some amazing acronyms here, so thank you for that, NASA.
TROPICS stands for Time-Resolved Observations of Precipitation structure and storm Intensity with a Constellation of Smallsats. Yup. They left out words from the acronym. Wow. Anyway, this mission is going to improve our observations of tropical cyclones, which are intensifying overall due to climate change. These six satellites will be deployed in pairs over three launches and should be up and running by the end of July.
Next is EMIT, or Earth Surface Mineral Dust Source Investigation. This mission is going to be to observe how dust is moved by winds from arid regions around the world. That dust can influence how much energy Earth reflects back out into space, which impacts the temperature at the surface. Darker, iron-rich minerals absorb energy and that causes the atmosphere to heat up. Lighter, clay-rich minerals scatter light and can lead to cooling. EMIT will map all of that dust and determine its composition to help understand what changes in temperature we might expect.
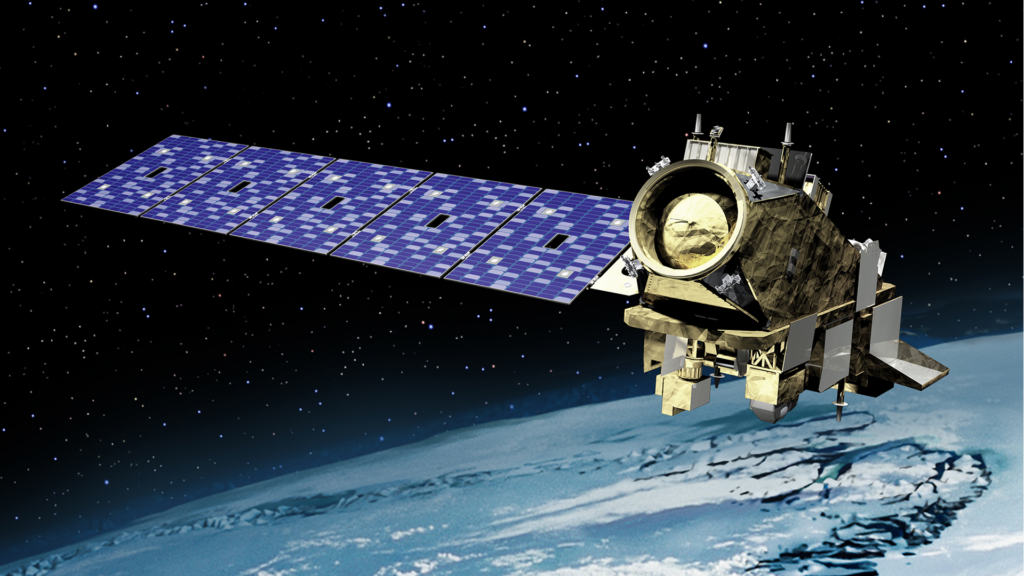
The Joint Polar Satellite System (JPSS) is going to precisely measure the temperature and moisture content of the atmosphere as well as ocean surface temperatures in order to help forecast extreme storms. The satellites will also observe floods, wildfires, volcanoes, dust storms, and sea ice. It’s basically going to be the backbone of weather prediction in the coming years.
Finally, SWOT or the Surface Water and Ocean Topography mission is going to measure Earth’s water in the oceans, lakes, and rivers. This data should help scientists understand how climate change affects freshwater and how the ocean’s ability to absorb excess heat and greenhouse gases changes over time. The mission is scheduled to launch on a SpaceX Falcon 9 in November 2022.
So while the climate change situation seems bleak, remember scientists are doing their best to understand it and maybe find solutions.
What’s Up
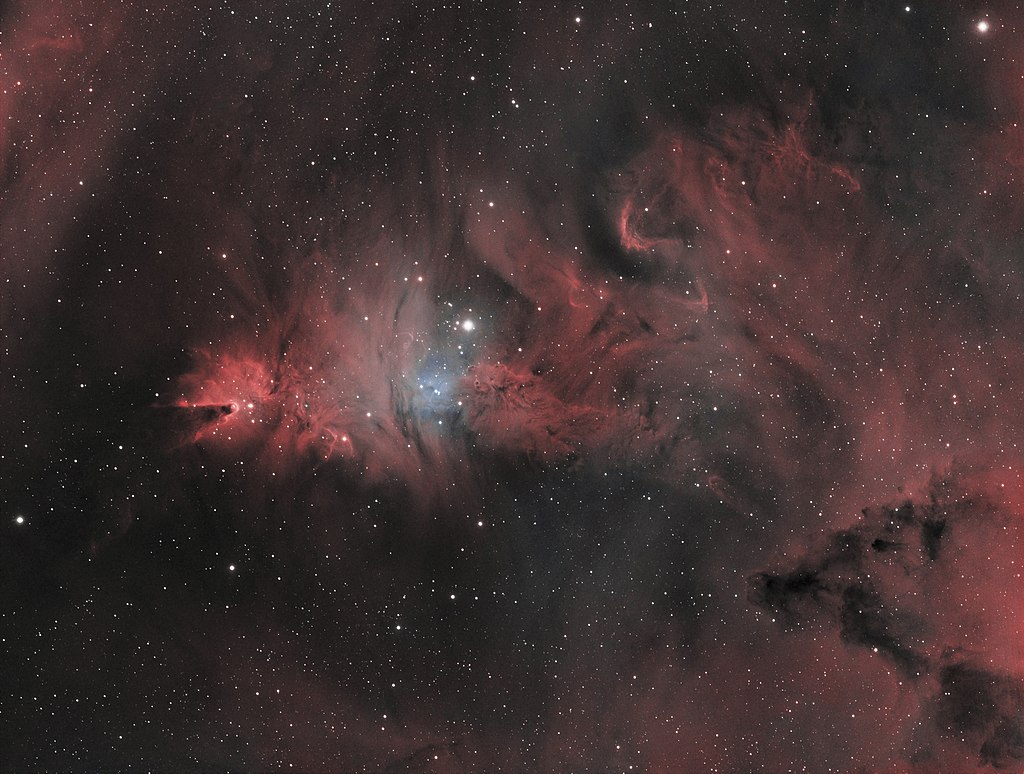
This week in What’s Up is a holiday object, the Christmas Tree Cluster, and also a bit of discussion on telescope accessories. The Christmas Tree Cluster is so named because it vaguely resembles the shape of a Christmas tree. Like many named objects in the sky, it only sort of resembles the thing it’s named after. Humans like naming things after other things they are familiar with.
The Christmas Tree Cluster is in an active star-forming region with a wide mix of stars of different ages. You can visually see stars of different colors, red and blue, when looking at this cluster.
If you could see in the infrared, many more young blue stars would be visible hiding in the gas and dust of the nebula.
The Christmas Tree Cluster, also called NGC 2264, has an apparent magnitude of +3.9, so it may be faintly visible with the unaided eye from darker skies. To find it, draw a line between bright stars Procyon and everyone’s favorite star that hasn’t gone nova yet, Betelgeuse, then go to the midpoint of the line and look slightly above it.
Alternatively, it is slightly lower in declination than the star Castor in the constellation Gemini, in the direction of another bright star, Sirius. It is very much closer to Castor than to Sirius.
But an even easier way is to use the finder chart available from the show notes for today’s episode.
So the Christmas Tree Cluster is fairly easy to find and is visible in binoculars or a small telescope. It’s also quite large at about 20 arcminutes in size. That’s a little smaller than the angular size of the Moon at its furthest distance from Earth, but you won’t be able to make out the Christmas tree shape of the gas around the cluster without a telescope at moderate magnification.
The winter months are great for astrophotographers because the cold temperatures lead to less turbulence in the atmosphere. This makes it easier to take sharper images. The Christmas Tree Cluster is also an easy cluster to image, mainly because of its brightness. It fills a full-frame sensor at 1.25 meters focal length, such as that provided by a 125mm f/10 SCT, like the one Erik has, a Celestron Nexstar 5SE. If you go wider, say 400mm like in a Short Tube 80 refractor, you can also fit a few more nearby emission nebulae into the frame, NGC 2247 and IC 2169.
A really fun way to try out different sensor/optic combinations on different targets you might image before you buy is to use the free astronomy software Stellarium. If you add the specifications of your camera into the Oculars menu in the top right corner of the application, it will project a rectangle on the sky depicting the area and extent that particular combination of optics and sensor produces. The imaging mode looks like a rectangle and is the second option from the left in the menu on the top right. If you’re a visual astronomer, you can also use this feature for eyepieces. The eyepiece mode looks like a hand controller and is the first option on the left in the top-right menu.
Erik’s advice is to not buy a whole bunch of different eyepieces covering every possible power your telescope can produce. If you have a lot of eyepieces, you will end up spending a lot of money but less on each individual eyepiece, meaning you will probably end up with a large number of low-quality eyepieces that will gather dust.
All you really need are four or five good eyepieces that are separated by about 50 times magnification. For example, Erik has 25mm, 12mm, 8mm, and 5mm eyepieces for his Nexstar 5SE, which provide approximately 50x, 100x, 150x, and 250x magnification, respectively. You can calculate the magnification an eyepiece will produce by dividing the focal length of the telescope in millimeters by the focal length of the eyepiece, also in millimeters.
We recommend the Astro Tech Paradigm or Agena Starguider Dual ED eyepieces as they are relatively inexpensive and have a wider apparent view than the standard eyepieces which come with a beginner telescope.
Be sure to check out the show notes for today’s show on DailySpace.org. We’ll include links to Stellarium and also some of the other gear we mentioned, including Amazon affiliate links so you can help support us.
This has been the Daily Space.
You can find more information on all our stories, including images, at DailySpace.org. As always, we’re here thanks to the donations of people like you. If you like our content, please consider joining our Patreon at Patreon.com/CosmoQuestX.
Credits
Written by Beth Johnson and Erik Madaus
Hosted by Beth Johnson
Audio and Video Editing by Ally Pelphrey
Content Editing by Beth Johnson
Intro and Outro music by Kevin MacLeod, https://incompetech.com/music/
 We record most shows live, on Twitch. Follow us today to get alerts when we go live.