
Using spectrographic data from several different telescopes, a team put together a three-dimensional model of planetary nebula NGC 1514, which allowed them to further study the shape and internal motion of the object. Plus, Antarctic sea ice, a history of current flow, magnetic waves, and an interview with astronaut Cady Coleman.
Media

Transcript
Hello and welcome to the Daily Space. I am your host Dr. Pamela Gay.
And I am your host Beth Johnson.
And we are here to put science in your brain.
Over the last year, we’ve talked about a lot of ways scientists are trying to measure both historic and current climate changes. From looking at tree rings in fossilized trees to looking at ice layers in Greenland ice, researchers travel the world, looking for old things that record seasonal cycles.
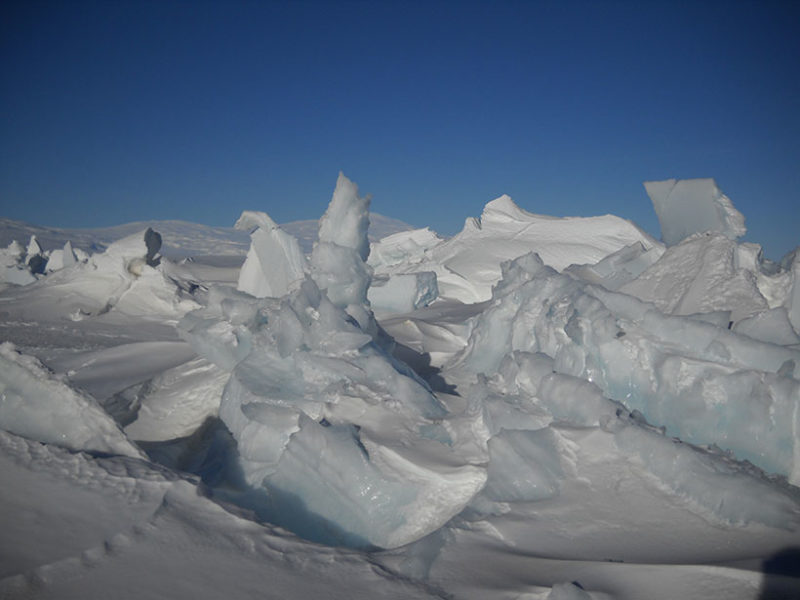
In new research appearing in Geophysical Research Letters, researchers led by Dominic Winski have looked at the salt deposits left behind by melting sea ice to get new data. Essentially, over the winter, sea ice is blown inland by storms: the more sea ice, the more gets blown inland. When that ice melts, it leaves behind salt in proportion to the amount of sea ice. That salt is then captured in ice cores.
According to their paper: Ice core data across Antarctica show increasing sea salt concentrations since 11,400 years ago, representing cooling and sea ice expansion, particularly between 8,000 and 10,000 years ago. Between 5,000 and 6,000 years ago, a drop in sea salt indicates an abrupt reduction in sea ice cover in the South Atlantic. Interestingly, paleoclimate data suggest that sea ice was more extensive in the North Atlantic at this time, indicating a linked and opposing sea ice signal in the North and South Atlantic most likely due to changing ocean circulation.
This finding is consistent with models that predict that changes in sea ice and glaciation will fundamentally change ocean currents. To those of you who feel like the last few years have gotten weirder and weirder? You are right. We are alive to see our world changing, and scientifically, this is an amazing opportunity, but I think it is an opportunity all of us would happily have passed up

Working on the other side of the world, researchers have been trying to recreate the circulation patterns in the North Atlantic, looking to see how and how fast these currents may have changed over time. Specifically, they are looking at the currents responsible for carrying warm water from the tropics up along the coast of Europe and the U.K. and moderating their winters.
The historical strength of these currents is reflected in seafloor samples that show what size grains were getting moved and allow the compositions to be measured and traced back. They find that major ice-melting events weakened these currents. While these events were triggered by warming climate melting glaciers, they also had the effect of cooling northern latitudes and triggering colder winters. This feedback led to wild oscillations in climate, currents, and glaciers over time.
This is a reminder that when we talk about climate change, we are looking at the average of what’s happening across our entire planet. That 0.5-degree change the planet sees may be a 10-degree increase in one place and an 11-degree decrease in another. As the glaciers melt and the oceans become less salty, ironically, northern Europe and the U.K. can expect much colder winters while the American southwest and other regions have hotter summers, and those of us in the middle latitudes just see more extremes. The world, it is a-changing.
Understanding our world requires us to understand the effects of minor changes to our atmosphere that are caused by pollution, volcanoes, and outgassing cows. (Since the cows are natural, we’re not going to call that pollution, although opinions may vary.) We also have to look at the Sun and its behaviors.
From 1645 to 1715, for instance, the Sun went through a weird low period with very few sunspots and none of its normal every 11-year maxima occurring. This period of solar minima, called the Maunder Minimum, coincided with drops in temperature on Earth that dramatically affected harvests. We still don’t know what happened, but the need to understand solar activity drives all sorts of research into the Sun’s magnetic fields.
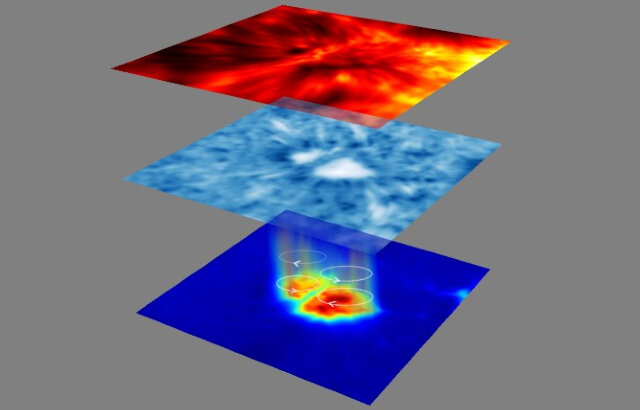
In a new study appearing in Nature Astronomy and led by Marco Stangalini, astronomers use high-resolution images of the solar atmosphere to study how magnetically driven waves called Alfven waves carry energy through the Sun’s atmosphere. Remarkably, they found that waves low down in the atmosphere are able to send energy up through a column of material, potentially even explaining why the Sun’s outermost layers are hotter than the lower layers. While these waves were predicted 50 years ago, it is only with today’s high-quality instruments and powerful computer models that we can finally study them in detail. As the still new Inouye Solar Telescope has more and more time to capture data, we can expect more breakthroughs.
While the Sun’s short-term fluctuations rarely affect our Earth at its surface, its periodic outbursts and changes in activity can wildly affect the Earth’s outer atmosphere, both by generating amazing aurorae and by causing the atmosphere to change in size over time. For low orbiting spacecraft, that change in size is a major issue as even a couple of hundred kilometers up, the rare atmospheric particles still create a drag on spacecraft, and that drag will eventually bring those spacecraft down.

Over the past sixty some odd years of launching things into space, researchers have come to notice that when the Sun is more active, more stuff is observed to fall out of orbit, and in general, it takes more effort to keep things in orbit. This effect can have dramatic impacts on modeling where and when space junk might fall to Earth and has to be included in long- and short-term models for objects ranging from decades-dead satellites to recently misplaced Chinese rockets.
In a new paper in The Astrophysical Journal Supplement led by Tatiana Podladchikova, a new software model is released that should allow solar radio activity to be predicted on timescales of one to 24 months, depending on the kind of activity. This software is called RESONANCE and should allow mission planners to better understand their fuel needs and how their dead missions will decay back to Earth. We are all a bit excited to see if their two-year estimates prove true, and I, for one, wish we could do this for more weather-related phenomena.
One of the most confusing and delightful objects in our sky is the planetary nebula. When initially discovered by early telescope builders, these often round blobs of light looked like planets but failed to wander relative to the stars the way planets do. As telescopes got better and better over the centuries, new details emerged, making these blobs resolve into still hard-to-see structures that looked like faces or geometric doodling.
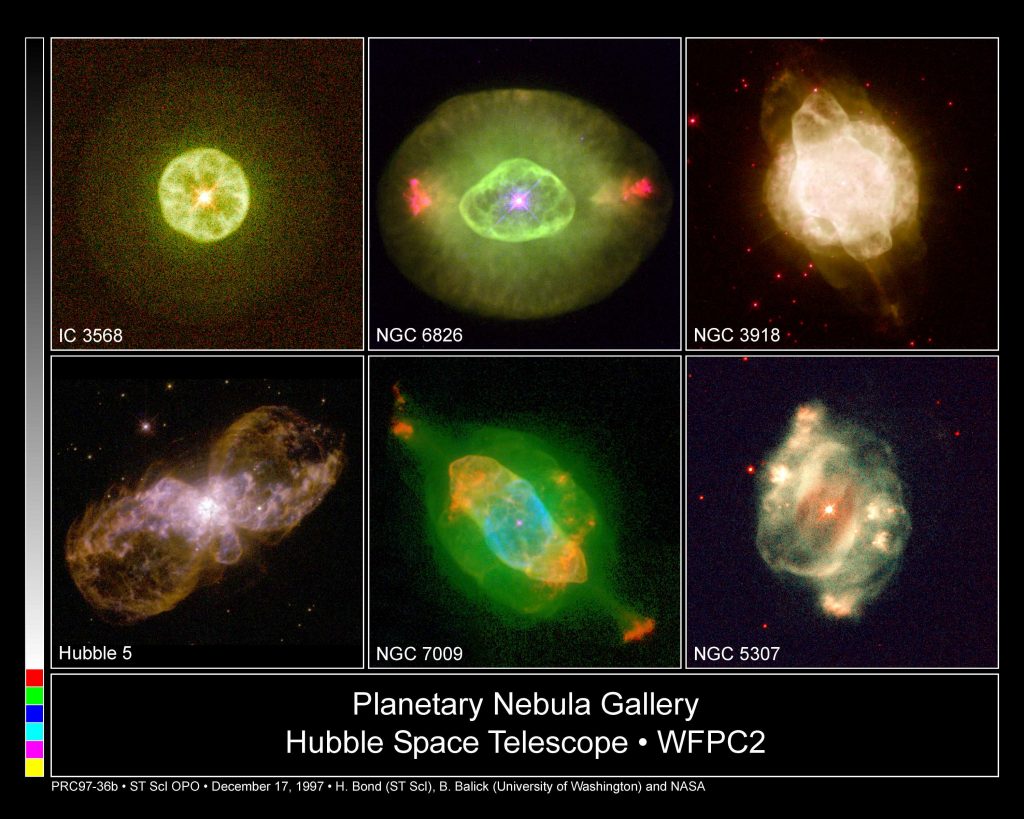
It was eventually understood that these nebulae form in the final stages of a middle-sized star’s life. When stars like our Sun come to an end, they exhale their outer layers and leave behind their core to form a white dwarf star. The shape of the resulting nebula depends on how that star puffs off its layers. Is it a continual process? Does it occur in pulsations? It is also is a function of what is around the star. Is there a neighboring star or surrounding planets to block the path of gas? To put all these pieces together, high-quality data is needed to describe the shape and anything else that can be measured.
One of the original justifications for the Hubble Space Telescope was to image planetary nebulae from above the atmosphere so the smallest possible details could be seen. Over recent decades, Hubble has not disappointed, and its rich catalog of images has brought home to all of us that what is going on is far more complicated than any of us realized from looking with ground-based telescopes.
With high-quality images in hand, folks realized we need more: we needed velocity data to explain to us how every knot and twist of gas is moving. In a paper shared on arXiv while undergoing peer review, researchers present data on planetary nebula NGC 1514 and show that this extraordinarily complex planetary nebula has a binary star system in its center, a morphology that is, so far, unique, and motions they can actually measure!
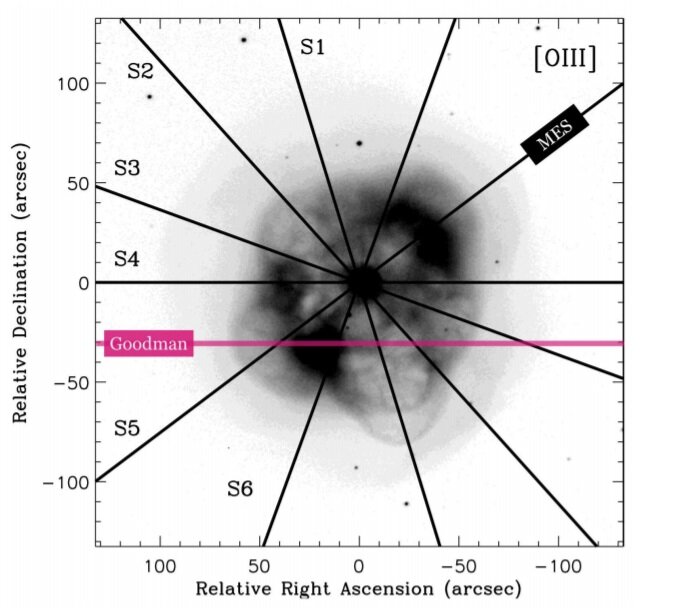
By placing a very thin slit into a telescope’s instrumentation, it’s possible to spread the light out into a spectrum that captures the specific motions, temperature, and composition of whatever happens to be located at each point along the slit. By looking at motions at many points throughout the planetary nebula, they were able to piece together this object’s complexity.
In the data, they found a parallel-like structure, two well-defined rings glowing cooly in infrared, and temperatures that allow argon, neon, and helium to glow brightly like naturally occurring neon signs. More data is still needed to understand what all of this means. More data and also a lot of computer modeling, but this research highlights that there is more than one way to probe planetary nebulae, and even the weirdest looking systems have the possibility to be understood.
Interview
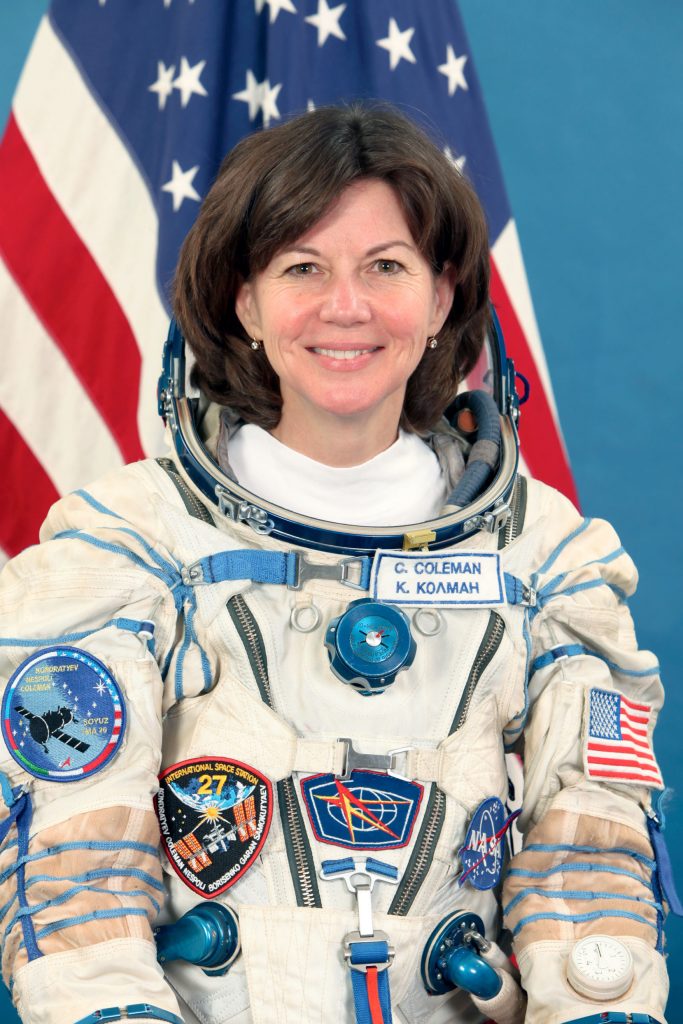
With me now is astronaut Cady Coleman. Dr. Coleman is a veteran of two Space Shuttle missions and spent six months aboard the International Space Station as a member of Expedition 26/27. She is also a member of Bandella, a band that includes several other former astronauts. She plays the flute and has performed with Ian Anderson of Jethro Tull in a space-based duet where she was on the ISS and he was performing at a concert in Russia. Now, with scientist Andrew Maynard, she co-hosts the new Slate and Arizona State University podcast, Mission Interplanetary, which looks at the challenges and opportunities for the future of humans in space. Welcome, Dr. Coleman, and thank you for joining us!
[Interview]
This has been the Daily Space.
Learn More
Climate Change Measured in Salt Deposits
- Eos article
- “Seasonally Resolved Holocene Sea Ice Variability Inferred From South Pole Ice Core Chemistry,” Dominic A. Winski et al., 2021 April 6, Geophysical Research Letters
North Atlantic Sensitive to Salt
- Eos article
- “The North Atlantic Glacial Eastern Boundary Current as a Key Driver for Ice-Sheet—AMOC Interactions and Climate Instability,” Samuel Toucanne et al., 2021 March 7, Paleoceanography and Paleoclimatology
Magnetic Waves Drive Solar Activity
- Queen Mary, University of London press release
- “Torsional oscillations within a magnetic pore in the solar photosphere,” Marco Stangalini et al., 2021 May 10, Nature Astronomy
New Solar Weather Models Help Satellites
- Skoltech press release
- “Medium-term Predictions of F10.7 and F30 cm Solar Radio Flux with the Adaptive Kalman Filter,” Elena Petrova et al., 2021 April 27, The Astrophysical Journal Supplement
Measured: Gas Motions in Planetary Nebulae
- Phys.org article
- “The morpho-kinematical structure and chemical abundances of the complex planetary nebula NGC 1514,” Alba Aller et al., to be published in Monthly Notices of the Royal Astronomical Society (preprint on arxiv.org)
Credits
Written by Pamela Gay and Beth Johnson
Hosted by Pamela Gay and Beth Johnson
Audio and Video Editing by Ally Pelphrey
Content Editing by Beth Johnson
Intro and Outro music by Kevin MacLeod, https://incompetech.com/music/
 We record most shows live, on Twitch. Follow us today to get alerts when we go live.