
Media

Summary
A data visualization designer has created an interactive graphic that allows us to explore all 50 gravitational wave events recorded to date, and some even have sounds! Plus, blue jet lightning and all the planetary science stories we can handle. Happy Friday!
Transcript
Hello and welcome to the Daily Space. I am your host Dr. Pamela Gay.
And I am your host Beth Johnson.
And we are here to put science in your brain.
A little less than five years ago, on February 11, 2016, scientists were able to announce the first-ever detection of gravitational waves being emitted during the merger of distant black holes. Gravitational waves are literal waves in space-time that stretch and contract the fabric of our universe as they sweep across space. We actually detect them through these stretches as they distort our world and massive laser systems at the LIGO and Virgo facilities in the US and EU.
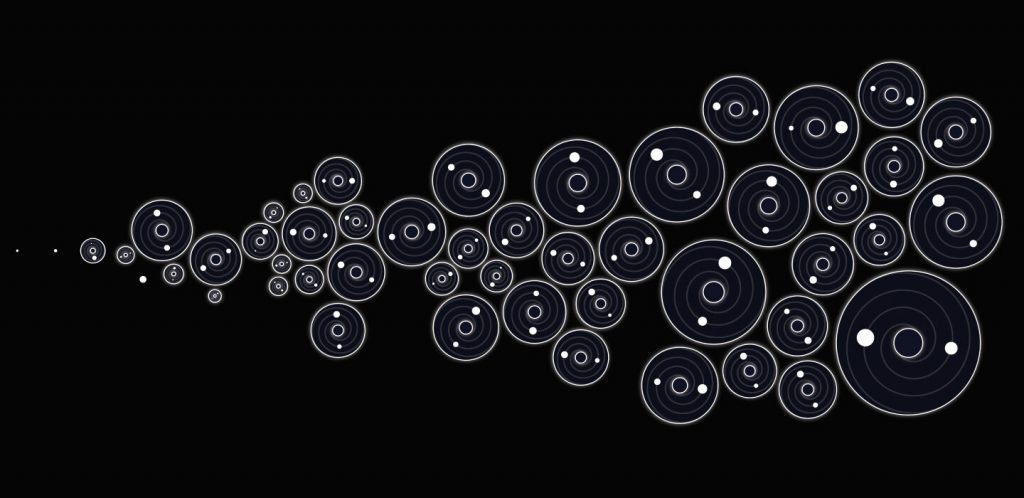
That first detection has been followed by many more, with the total published hitting fifty in October 2020. From merging neutron stars that produce gold to merging massive black holes that hint at the origins of supermassive black holes, the diversity of these systems has been impressive, but hard to capture in any one picture, graph, or paper. To try to express the breadth of what they’ve seen, the LIGO and VIRGO collaborations partnered with data visualizer Nadieh Bremer to create an interactive infographic that puts all these events into context: showing when they occurred in time and the diversity of their sizes. Not only can you look at the information, but you can also listen — key mergers have been translated into sound files so that you can hear the gravitational waves.
We’re linking to this infographic on our website DailySpace.org, and we encourage all of you to check it out.
Most striking to me was how this infographic reminds us of the sheer size of our universe and the time it takes even light to travel. The nearest source of gravitational waves so far detected was a neutron star collision that occurred more than 100 million years ago and generated waves that passed over Earth in 2017. The biggest merger observed came from two black holes that merged before our Sun had even formed.
Space is vast, and yet gravitational waves sweeping through this vastness can literally — for the smallest moments — reshape us in ways that we may not notice, but our scientific detectors can see.
And then there are things that our detectors cannot see, like dark matter. This is why you have to look to different ways to try and find certain particles. In this case, scientists are hunting for the elusive axion, and to do this, they used data taken by NASA’s NuSTAR telescope of one of our favorite stars, Betelgeuse.

NuStar is capable of focusing high-energy X-rays, and the team collected 50 kiloseconds of data from Betelgeuse. The reason they chose this star is that, as we all learned last year, Betelgeuse is on the verge of going supernova, astronomically speaking. And we hypothesized that axions will be produced by stars in this condition, and those axions will interact with magnetic fields and briefly couple to photons in the X-ray band, giving us a chance to “see” them. Since axions are a theoretical superlight particle that makes up dark matter, we cannot expect to see them otherwise.
This new paper was published in Physical Review Letters, and coauthor Kerstin Perez explains further: Betelgeuse is at a temperature and lifestage where you don’t expect to see X-rays coming out of it, through standard stellar astrophysics. But if axions do exist, and are coming out, we might see an X-ray signature. So that’s why this star is a nice object: If you see X-rays, it’s a smoking gun signal that it’s got to be axions.
Unfortunately, the team came up empty-handed, but a null data set is still a data set, and these results put new constraints on just where and how we can find axions. Perez sums up the lack of discovery: What our results say is, if you want to look for these really light particles, which we looked for, they’re not going to talk very much to photons. We’re basically making everyone’s lives harder because we’re saying, ‘you’re going to have to think of something else that would give you an axion signal.’
Now scientists will have to use other, less detectable energy bands to try and find these axion signals. If only Beteguese would actually go supernova, then we could see if the explosion pushes the axions to couple with gamma rays. Meanwhile, the search for axions continues.
As we mentioned yesterday, there is a small fleet of spacecraft currently nearing Mars as they get ready to land in February. Mars and Earth line up to create ideal launch windows every few years, and I still clearly remember when the Mars Exploration Rovers, Spirit and Opportunity, landed a few weeks apart in the winter of 2004. I was living in Boston at the time, and the weather was warmer on Mars than it was outside my windows, and I felt a little jealous of those two robots sitting in the Sun under an alien sky.
The thing is, while those days, near the Martian equator, were warmer than a Boston winter, Mars, in general, is not someplace that can support life easily. The atmosphere is far too thin to breathe, radiation rains on the surface, and temperatures can drop to -100 Fahrenheit. While we can dream of visiting Mars, life there would be terribly hard. At least it would be today. In the past, Mars had a significantly thicker atmosphere, and with it came warmer temperatures, less radiation, and even weather capable of generating rivers and lakes.
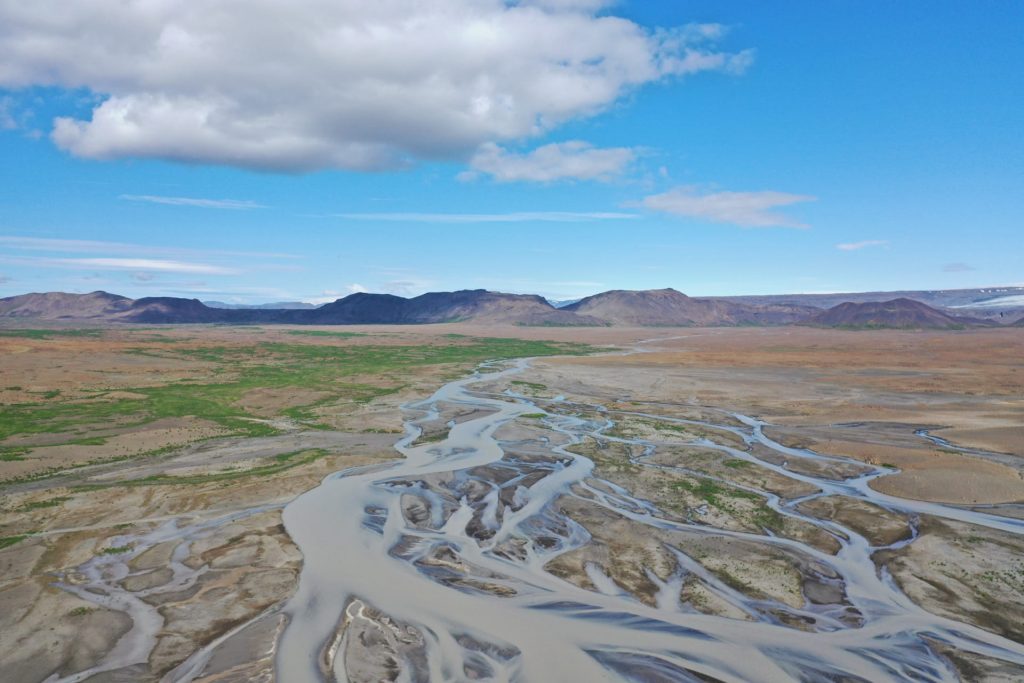
Mars Curiosity rover, a mobile robotic laboratory, has been exploring the site of one of these former lakes since it landed in 2012. A new paper published in JGR Planets with lead author Michael Thrope describes mudstones and sedimentary rocks that were studied by Curiosity. These minerals were compared to similar stones and rocks on Earth as researchers sought conditioners here capable of weathering the landscape the same way Mars was once weathered. According to study co-author, Kirsten Siebach: The range of climates on Earth allowed us to calibrate our thermometer for measuring the temperature on ancient Mars.
They found that ancient Mars, or at least the part of ancient Mars at the bottom of Gale crater, was geologically similar to modern Iceland down to the compositions as they looked at how weather was able to alter the chemistry of the rocks.
Siebach goes on to explain: As water flows through rocks to erode and weather them, it dissolves the most soluble chemical components of the minerals that form the rocks. On Mars, we saw that only a small fraction of the elements that dissolve the fastest had been lost from the mud relative to volcanic rocks, even though the mud has the smallest grain size and is usually the most weathered. This really limits the average annual temperature on Mars when the lake was present, because if it were warmer, then more of those elements would have been flushed away.
While it is unfeasible to imagine terraforming Mars to return back to that Iceland-like climate, it is still tantalizing to imagine that for ever so short a geologic time, Mars was capable of supporting life — just like Iceland — and I can’t wait until we’re landing fossil hunting robots on this nearby world.
How about sending a robotic submarine to Titan? That’s what astronomers at Cornell University would like to do, as they recently published a paper in the JGR: Planets that details their findings on Titan’s largest sea, Kraken Mare.

Titan is Saturn’s largest moon, and it has an atmosphere and liquid lakes. Now, those lakes aren’t full of water; they are full of methane. And Kraken Mare has been found to be 1000 feet deep at its center, which is a great depth for a robotic submarine. The team at Cornell used data from flybys of Cassini to determine both the depth and the composition of Kraken Mare. For some reason, it was the only sea on Titan that had not been measured, and it contains nearly 80% of the moon’s surface liquids.
Amazingly, the Cassini data used was taken during a flyby that was observing Titan for a different sea — Ligeia Mare — where images captured a disappearing and reappearing “Magic Island”. The radar altimeter took depth soundings of both Kraken Mare and Moray Sinus, which is an estuary at the northern end of the sea. Moray Sinus is only 280 feet deep, too shallow for the radar to acquire data useful in determining the composition of the liquid.
However, Kraken Mare’s depth of 1000 feet helped the researchers determine that its composition was similar to that of Ligeia Mare. This was an unexpected result as the expectation was that Kraken Mare, and yes, I’m going to say it over and over as it’s an awesome name, would be more ethane-rich. But no. It’s dominated by methane still, and as we talked about in a story last year, the continued existence of liquid methane on Titan is a bit of a puzzle. Methane in the atmosphere is converted by Titan’s solar light into ethane and should be depleted in the lakes and seas.
So let’s start planning for that robotic submarine and go solve this mystery.
Speaking of mysteries, there’s an Earth-based mystery recently solved. It involves lightning. Specifically, a particular transient luminous event (TLE) called a blue jet. We’ve seen them from the ground a few times, but like most TLEs, they are rare. However, it’s important to understand what causes these events because electrical bursts can affect radio waves and impact communication.
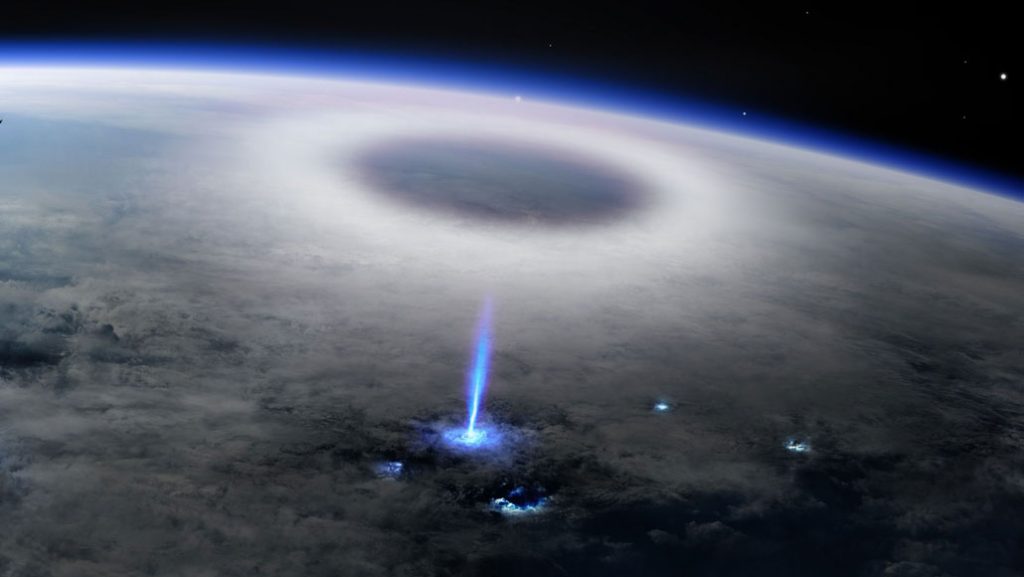
Instruments on the International Space Station (ISS) spotted a blue jet in February 2019, and the results were published this week in the journal Nature. The jet occurred during a storm over the Pacific Ocean near the island of Nauru, and cameras and photometers managed to collect data from the event. It started with what is described as a “blue bang” by lead author Torsten Neubert. The bang was a flash of blue light about 10-microseconds long that occurred near the top of the storm clouds, nearly 16 kilometers in altitude. A blue jet then shot up from that flashpoint, reaching nearly 52 kilometers and only taking a few hundred milliseconds to do so. Hence why collecting data on these TLEs is so difficult; not only are they rare to begin with, they are also brief.
Neubert goes on to explain that “turbulent mixing high in a cloud may bring oppositely charged regions within about a kilometer of each other, creating very short but powerful bursts of electric current.” We have detected such bursts with ground-based antennae, and it’s nice to piece together all the evidence. One mystery solved.
A lot of scientific discoveries come when someone just happens to be looking in the right place, in the right way, and at the right time. Quite by accident, a team of researchers studying the release of methane from the Arctic seafloor discovered that our moon not only raises tides in the water but also flexes the Earth enough to influence the release of gases. The team, led by Nabil Sultan, embedded sensors seven meters into the Arctic seabed for four days at depths ranging from 910 to 1,330 meters and found that at low tide, when the water column dropped, gas seeped slowly, and when the tide rose and there was more water weighing the column down, methane was able to seep out through seabed fractures more readily. This work appears in the journal Nature Communications.

Sultan uses these results to make a call to action: We need to consider how pressure will impact this gas system.…It’s urgent today to go study in more detail the shallowest areas in the Arctic or in areas where you have a high concentration of gas and gas hydrates.
The water depth changes Sultan’s team was observing were due to the Moon’s tides, and the release of methane fluctuated. If the water levels instead rise due to the melting of sea ice, there will be no low tide to shut down the release of gas. Since methane is a greenhouse gas, it’s important to understand what kind of a future release we’re looking at.
This is a reminder that while we don’t completely understand our world, so far the majority of errors we’ve found in our climate models were ones that allowed our world to stay cooler. With every new data set, it seems, we are finding new factors that will only increase our world’s warming. Things like this always remind me of the Into the Woods quote: It’s nice to know a lot, but a little bit not.
We can only hope that the more we learn, the more we will be able to take action to protect our world and ourselves.
Something that comes up a lot around here, and will in fact come up in the next story, is the problem of planet formation. We understand some of the big picture concepts of what happened, but the details are all a bit mysterious and up for debate. Simple questions like, where did Earth’s atmosphere and ocean water come from, actually lack clear cut answers. Sometimes, the best we can do is look very closely at what we have here, and then compare our world’s elements with the composition of meteorites that we know came from other places in our solar system.
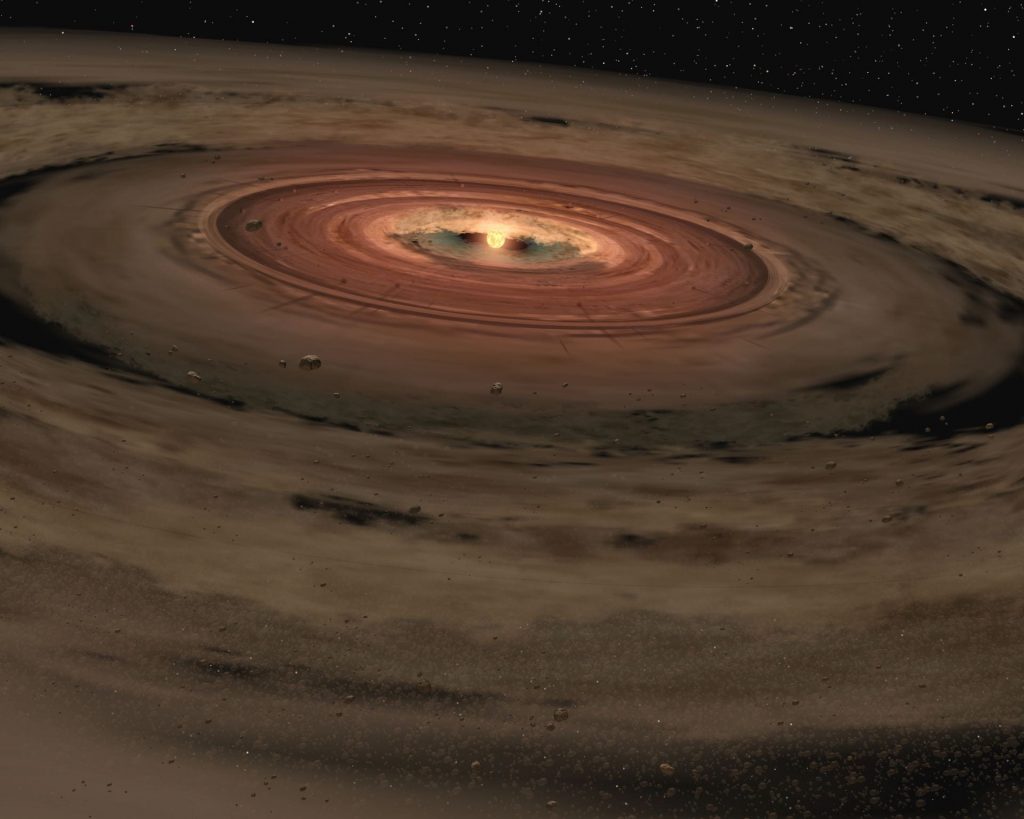
We think, early in the solar system’s formation, the gas and dust that formed the planets varied with distance from the Sun due to the Sun’s heat and wind changing and moving material around. While nitrogen was scattered throughout the young solar system, the isotopes of nitrogen varied from place to place, and these differences can be measured by looking at nitrogen trapped inside meteorites. In a new study appearing in Nature Astronomy and led by Damanveer Grewal, researchers look at the isotopic signature of nitrogen in a variety of iron meteorites and find indications that our world has nitrogen that originated from both beyond Jupiter and from the inner parts of our solar system.
Nitrogen, and other elements that exist as gases and moderate temperatures, as we have here on Earth, are also called volatiles because of how they expand from ice to gas, as is seen so beautifully in comets.
According to Grewal: Researchers have always thought that the inner part of the solar system, within Jupiter’s orbit, was too hot for nitrogen and other volatile elements to condense as solids, meaning that volatile elements in the inner disk were in the gas phase. Our work completely changes the current narrative. We show that the volatile elements were present in the inner disk dust, probably in the form of refractory organics, from the very beginning. This means that contrary to current understanding, the seeds of the present-day rocky planets — including Earth — were not volatile-free.
This means our world’s nitrogen – or rather some of our world’s nitrogen – has been with us from the beginning. Our world might not have started as a molten rock that had to wait for colliding comets and asteroids to bring it the stuff that makes up our atmosphere and oceans. This is observational data, not a theory or model. Time is still needed to explain how this all happened.
Every week, we bring you more stories on how the solar system formed. Or how other planetary systems form. Or are forming. So much formation. And I keep saying we’ll never figure it out because there are too many variables and nothing seems to be a standard.
Here we go again. This time, a new paper in Science looks at how our solar system formed in a two-step process that split up the planets into dry terrestrial planets and wet outer planets. I’m using the terms dry and wet rather loosely, I know. Lead author Tim Tichtenberg explains: Inner Solar System planetesimals became very hot, developed internal magma oceans, quickly formed iron cores, and degassed their initial volatile content, which eventually resulted in dry planet compositions. In comparison, outer Solar System planetesimals formed later and therefore experienced substantially less internal heating and therefore limited iron core formation, and volatile release.
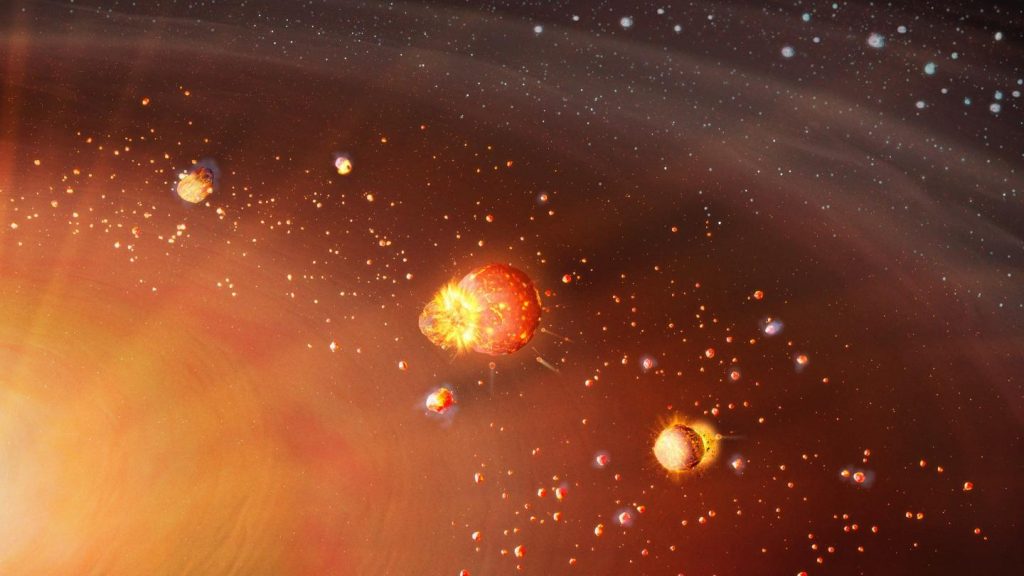
Essentially, we had two distinct formation episodes in our solar system: the first had an early onset and took a long time, building the inner solar system slowly enough to allow rocky planets to come together. The second occurred later and much more quickly, with wetter particles beyond the snow line, giving rise to quickly spun up gas giants and smaller terrestrial bodies.
Tichtenberg further noted: The early-formed and dry inner Solar System and the later-formed and wet outer Solar System were therefore set on two different evolutionary paths very early on in their history. This opens new avenues to understand the origins of the earliest atmospheres of Earth-like planets and the place of the Solar System within the context of the exoplanetary census across the galaxy.
This work gives a very broad overview of our solar system’s formation process that could apply to other planetary systems, but I still don’t think it’s the end result we’re looking for. More research is needed, as always, before we get a complete picture that covers more of the nuances of planetary system formation.
This has been the Daily Space.
Learn More
Interactive Graphic Explores Gravitational Wave Events
- Science News article
Axion Search at Betelgeuse Comes Up Empty
- MIT press release
- “Constraints on Axionlike Particles from a Hard X-Ray Observation of Betelgeuse,” Mengjiao Xiao et al., 2021 January 21, Physical Review Letters
Mars Felt Like Iceland Once Upon a Time
- Rice University press release
- “Source‐to‐Sink Terrestrial Analogs for the Paleoenvironment of Gale Crater, Mars,” Michael T. Thorpe, Joel A. Hurowitz, and Kirsten L. Siebach, 2021 January 18, JGR: Planets
Titan’s Kraken Mare Estimated at 1000 Feet Deep
- Cornell University press release
- “The Bathymetry of Moray Sinus at Titan’s Kraken Mare,” V. Poggiali et al., 2020 November 12, JGR: Planets
ISS Sensors Find Source of “Blue Jet” Lightning
- Science News article
- “Observation of the onset of a blue jet into the stratosphere,” Torsten Neubert et al., 2021 January 20, Nature
Tidal Influence Extends to Arctic Deep Seas
- Eos article
- “Impact of tides and sea-level on deep-sea Arctic methane emissions,” Nabil Sultat et al., 2020 October 9, Nature Communications
Much of Earth’s Nitrogen Locally Sourced
- Rice University press release
- “A very early origin of isotopically distinct nitrogen in inner Solar System protoplanets,” Damanveer S. Grewal, Rajdeep Dasgupta and Bernard Marty, 2021 January 21, Nature Astronomy
Two Steps of Our Solar Sytem’s Formation
- EurekaAlert article
- “Bifurcation of planetary building blocks during Solar System formation,” Tim Lichtenberg, 2021 January 22, Science
Credits
Written by Pamela Gay and Beth Johnson
Hosted by Pamela Gay and Beth Johnson
Audio and Video Editing by Ally Pelphrey
Content Editing by Beth Johnson
Intro and Outro music by Kevin MacLeod, https://incompetech.com/music/
 We record most shows live, on Twitch. Follow us today to get alerts when we go live.