
Media

Summary
Researchers measured the concentration of carbon-14 in tree-ring archives to recreate over one thousand years’ worth of solar activity. Plus amazing solar structures, earthquake forensics IN SPACE, Martian glaciers, a cold quasar, and our weekly What’s Up segment.
Transcript
Hello and welcome to the Daily Space. I am your host Dr. Pamela Gay.
And I am your host Beth Johnson.
And we are here to put science in your brain.
One of the bigger stories we covered last year was the start of solar cycle 25, where our Sun has finally moved out of a solar minimum and begun to show surface activity such as sunspots once again. The Sun cycles between minimum and maximum every eleven years, and we know this fact due to 400 years of careful observations. Galileo didn’t go blind for nothing, after all.
However, it’s not that we didn’t know about sunspots before the invention of the telescope. It’s that they weren’t documented in detail. And since we can only observe the sun indirectly as things like sunspots are surface features that merely hint at the underlying activity, scientists have been trying to find a way to push that record of solar cycles back as far as possible.
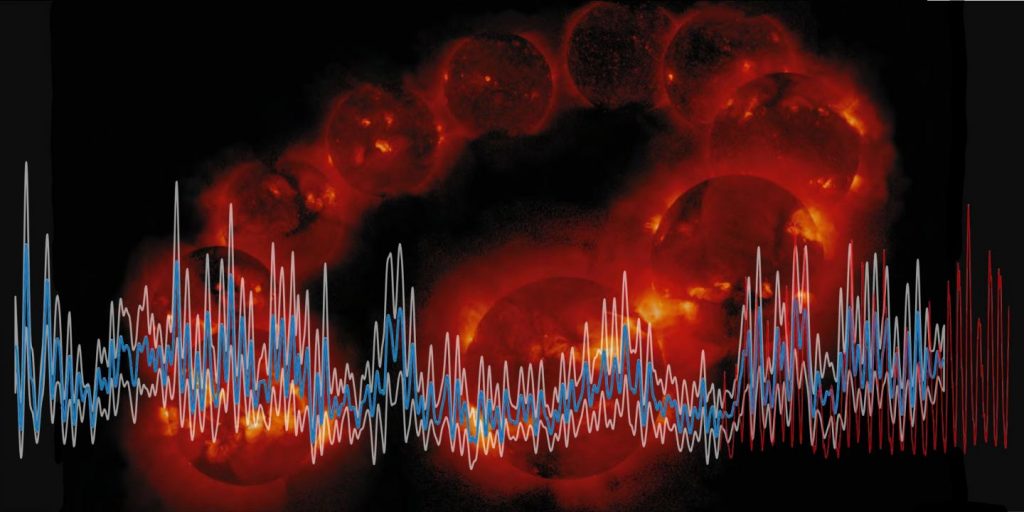
Now, a new paper in Nature Geoscience explains how a team of researchers led by the Laboratory of Ion Beam Physics at ETH figured out how exactly to recreate nearly one thousand years’ worth of solar activity data. They did it by using a very terrestrial method — tree rings.
It turns out that we have tree ring archives in places like England and Switzerland that can date trees back nearly 14,000 years. As many of us learned as children, you can date a tree by counting the number of concentric rings in its trunk. With those rings, you can not only understand the age of the tree but also many of the conditions that it grew under, such as flood or drought or fire. And you can even sample the radioactive carbon-14 isotopes in the rings, which is what this team eventually did.
Carbon-14 is mainly produced by cosmic particles, and the magnetic field of the Sun is influential in keeping those particles away from the Earth. So when the Sun is more active, the magnetic field is stronger, and fewer isotopes of carbon-14 get through to the surface of the planet. By sampling each ring in the tree and determining the amount of carbon-14, we can now tell how active the Sun was relative to other years. The team produced a reconstruction of solar activity from the years 969 to 1933.
So did the eleven-year cycle with which we are familiar hold up under a millennium of data and calculations? Yes. Yes, it did. Additionally, they gained insight into the varying amplitude of the cycles in relation to the length of the minima. They confirmed the existence of a “solar energetic proton event” in 993 where a solar flare caused an overproduction of carbon-14. And they found two more such events in 1052 and 1279, which may help other researchers understand how often such events can occur. These are the kinds of events that can break our satellites and power grid, so it’s always good to know more about them.
Now the team plans to use the rest of that tree-ring data, the stuff that goes back 14,000 years, and try to reconstruct the solar activity all the way back to the last ice age. We wish them luck and look forward to sharing their findings with you here on The Daily Space.
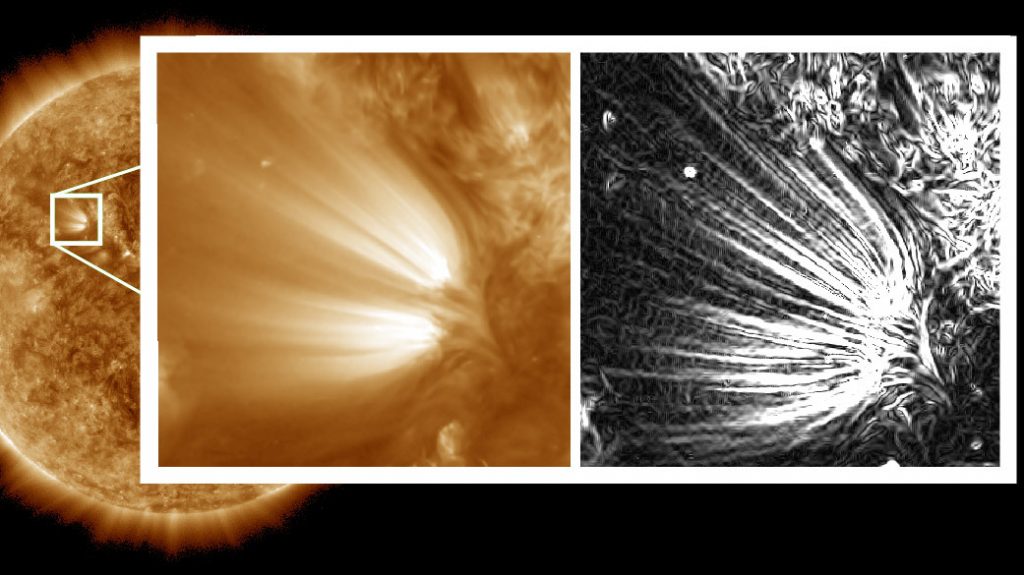
The average person goes through life seeing the Sun primarily as a glowing orb of unchanging light that they should know will burn their eyes if they do more than glance across its place in the sky. Observed with the appropriate equipment, the Sun reveals more and more complexity the more we zoom in. To an observer anywhere in the solar system, the Sun is the source of a permanent wind that, like our own world’s moving air, changes in pattern and strength. Just as a small depression in the atmosphere off the coast of Africa can intensify into a hurricane, tiny features in the Sun’s atmosphere seem capable of magnifying into magnificent storms of a very different variety, as fluctuating magnetic fields accelerate charged particles.
Now, using a combination of high-resolution data from various NASA missions, researchers have carefully studied how tiny plumelets can evolve over time, affecting space weather solar system wide.
These plumelets are only a few thousand miles across and can combine to form fifty to one hundred thousand-mile across plumes. What else they can do is still to be learned, but in their paper, which appears in The Astrophysical Journal, researchers led by Vadim Uritsky hint that they may be responsible for features as weird as sudden reversals in the solar winds magnetic field that were observed by the Parker Solar Probe last November.
This is a newly discovered phenomenon, and exactly what it does and doesn’t do will take time to understand.
We had an earthquake here last week. It was a relatively tiny one, only a 4.2 moment magnitude, but it shook the house, rattled the windows, and made my desk chair sway a bit. I don’t panic. I took too much geology to panic. I tend to feel excited, even when it’s a sizable quake. What we get here in the San Francisco Bay Area on our lovely San Andreas transform fault is still nothing compared to what happens in some of the worst quakes along the ring of fire. These occur where one plate subducts under another, essentially diving down below it. Those quakes are tremendous, and they rattle places like Alaska, Japan, and Chile with alarming frequency.
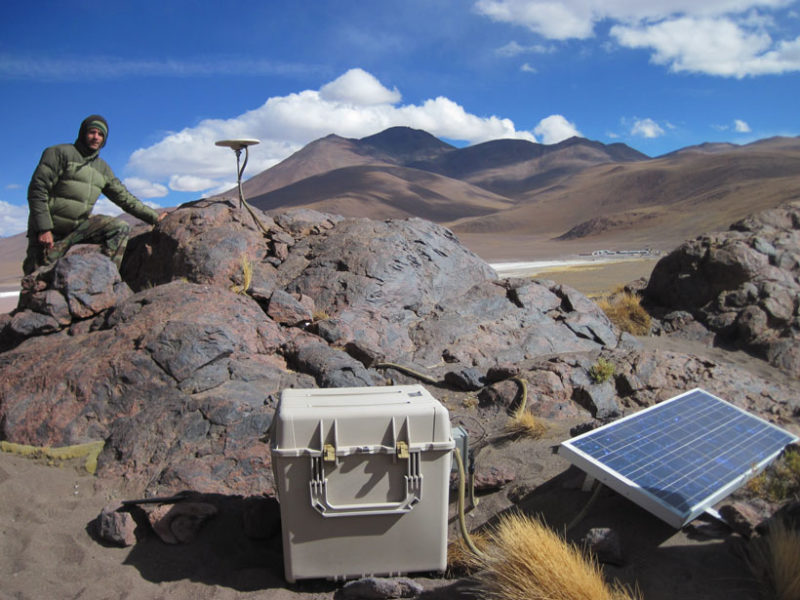
One of the ways we track the results of these quakes, and in fact, most quakes in places where there are usually quakes, is a sophisticated and extensive network of GPS monitoring systems. The ground-based sensors are linked to GPS satellites in orbit, and when a quake happens, even the slightest change in position or elevation is recorded, and we can piece together just how the ground moved as a result.
Usually, scientists work their way forward from the type of rock, its viscosity, the layer’s thickness, and what not to figure out why the GPS data changed the way it did. This is a forward model. Now a team of scientists has applied a new method, an inverse method, what is called “data inversion”. They take all of that post-quake positional data and work backward to measure how the positions changed over time, and what kinds of stress and strain in the rocks would react that way. Instead of predicting earthquake reactions, they work to understand the properties of the plates that led to the deformation.
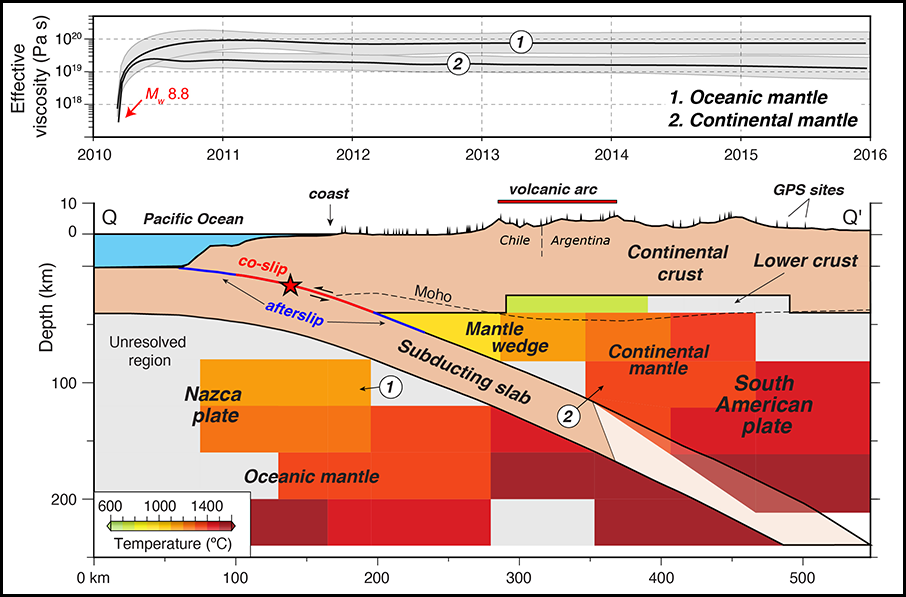
It turns out that this method requires far less computational power and time than the forward model. The team applied it to an 8.8 moment magnitude quake in Chile back in 2010, and they were able to see how the viscosity of the two plates changed over time. Using their method, they are now able to increase how much we know and understand about subduction zones, and it’s another piece of the puzzle for maybe, possibly, someday being able to determine where earthquakes will occur.
Studying our Earth from Space helps us see it as a planet, and as we explore Mars more and more from the ground, rovers and landers are helping us see how much it is like Earth.
One of the remarkable discoveries of this century is the presence of dust and dirt covered glaciers just beneath the Martian surface. Like glaciers on Earth, the Martian features end in rubble piles where the glacier deposited debris it had carried with it across the world. In a new study of 45 of these tongs of debris, a team led by Jo Levy has worked backward to figure out how Mars was oriented when the glaciers were deposited, and when over time things happened.
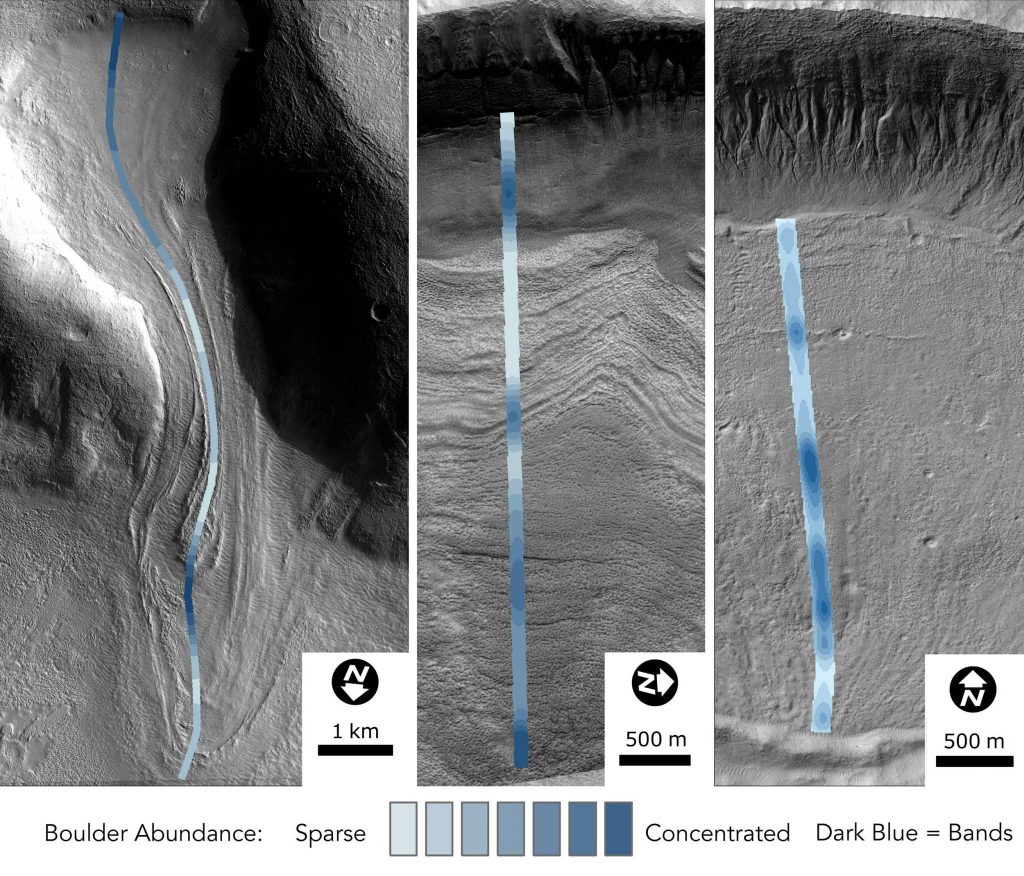
Unlike Earth, Mars’s orbit and tilt both wander as it is yanked by Jupiter and not stabilized by a moon like ours. As new places on Mars become its north and south poles, glaciers can form in new places, and when Mars strays particularly far from the Sun, it can trigger those glaciers to form. According to this study, published in the Proceedings of the National Academy of Sciences, the locations of glacial debris on Mars indicates that present-day glaciers were deposited at multiple times through Mars history, and “may preserve ice spanning multiple glacial/interglacial cycles, extending Mars climate records back hundreds of millions of years.”
Let me put it another way: Mars has had more than one ice age, and it looks like glaciers from millions of years of periodic ice ages are still on Mars, covered in protective dust and soil, waiting for us to dig in and explore Mars history. This paper was led by Joseph Levy and makes me hope we’ll have glacier-exploring robots in the not too distant future.
It seems that an overarching theme for today’s show is figuring out how processes work over time: how the Sun’s activity has changed, how Earth’s plates have changed, how Mars’ glaciers have changed. And now, I bring you a story of how scientists have observed changes in the planet-forming disk of a young star to see where a planet is forming.
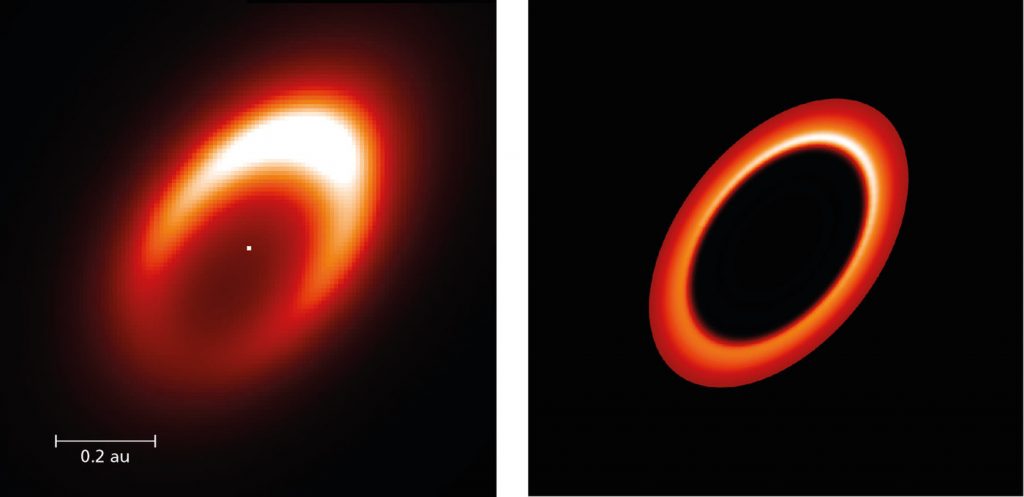
This new paper was published today in the journal Astronomy & Astrophysics with lead author Jozsef Varga and discusses observations of the protoplanetary disk around HD 163296. At a distance similar to that of Mercury from the Sun, there is growing evidence for a vortex at the inner rim of the disk. Vortices such as this one are where astronomers have long suspected that planets form in a convergence of dust and small particles.
The team used a new instrument on the Very Large Telescope Interferometer called MATISSE, which is another unwieldy backronym that stands for Multi AperTure mid-Infrared SpectroScopic Experiment. Seriously, folks. Stop letting us name things.
This paper is the MATISSE team’s first publication and is part of a Guaranteed Time Observation (GTO) program that will study more systems like HD 163296. The director of the Max Planck Institutes for Astronomy and for Radioastronomy, Gerd Weigelt, noted: This first scientific result marks the starting point for further research. One of the goals is to study stars with dust disks and specifically those in which Earth-like planets can form.
This program is definitely one to watch. We’ll keep you updated as they publish more results.
As with many things in life, the universe is filled with things you can only see if you look just the right way. Today we’re learning that when it comes to finding massive galaxies with massive jets, the MeerKAT radio observatory in South Africa has the sensitivity to see things like never before.
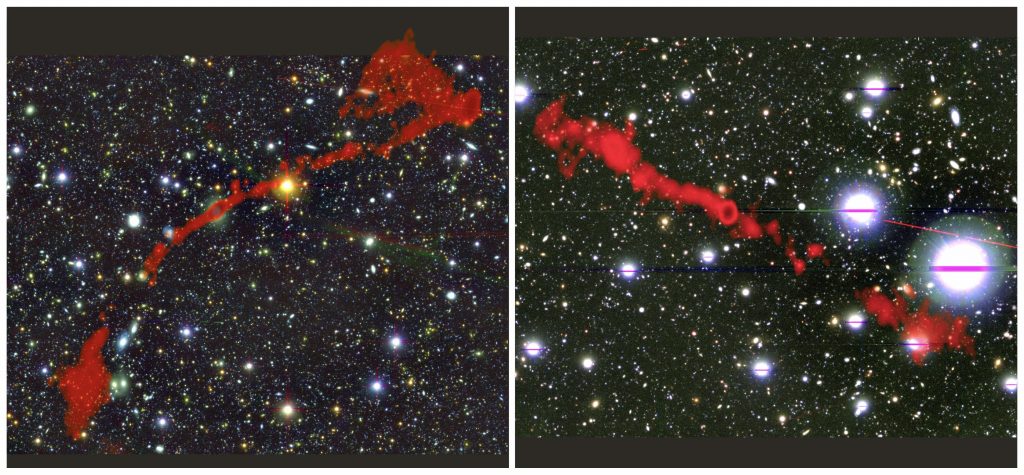
We have known for many decades that there are galaxies with glorious jets of particles streaming away from their cores that produce radio light. So far very few have been found, especially those with extremely long jets, but MeerKAT was able to find two giant radio galaxies with jets more than twenty times the size of the Milky Way. Surprisingly, these systems were both found in a remarkably small patch of the sky during a new survey.
According to study lead author Jacinta Delhaize: We found these giant radio galaxies in a region of sky which is only about 4 times the area of the full Moon. Based on our current knowledge of the density of giant radio galaxies in the sky, the probability of finding two of them in this region is less than 0.0003 percent. This means that giant radio galaxies are probably far more common than we thought!
A release related to this paper, which appears in the Monthly Notices of the Royal Astronomical Society, goes on to explain: It is thought that the giants are the oldest radio galaxies, which have existed for long enough (several hundred million years) for their radio jets to grow outwards to these enormous sizes. If this is true, then many more giant radio galaxies should exist than are currently known.
These two systems were discovered thanks to the remarkable sensitivity of MeerKAT, and this new telescope is only a precursor of things to come. Not only will MeerKAT be observing more of the sky, but the construction of an even larger and more sensitive system, called the Square Kilometre Array, will begin later this year.
From massive galaxies with massive jets, I take you to a galaxy on the verge of dying. Last week, I told you about one that was dying because of a collision. This time, we have a galaxy whose supermassive black hole is just starting to consume and accrete the stars nearest it. It’s part of a new family of galaxies called “cold quasars” where there is an active black hole emitting high energy X-rays as well as colder gas shining dimly in infrared light.
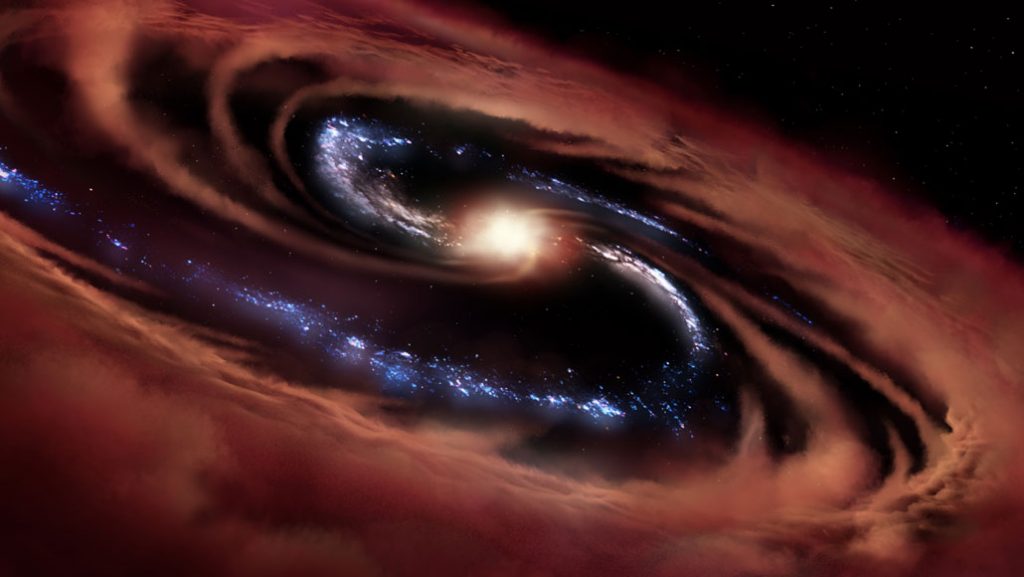
This work was presented at last week’s AAS meeting, and co-author Kevin Cooke explained: When you see a black hole actively accreting material, you expect that star formation has already shut down. But cold quasars are in a weird time when the black hole in the center has just begun to feed.
Cold gas can still collapse and form stars. With a quasar, the black hole and its ferocious appetite heat up what unused gas is left in the galaxy to the point where it cannot coalesce and some is even blown away by the higher energy particles. But now, we’ve about two dozen of these cold quasars, and the researchers were able to observe one of them, CQ 4479, using the SOFIA airborne observatory. SOFIA does observations in the infrared, which is perfect for finding all that cold gas.
As a result of the new observations, the team found that CQ 4479 has about 20 billion times the mass of the sun in its stars, and its rate of star formation is essentially the same as the black hole’s rate of growth. This stage in the evolution of galaxies changes our theories on galaxy evolution. As co-author Allison Kirkpatrick noted: You should have all your stars finish growing first, and then your black hole grows. This [galaxy] shows there’s a period that they actually do grow together.
They estimate that CQ 4479’s black hole will go passive in about half a billion years. I doubt we will be covering that event when it happens, but I’m sure the team will find other examples and piece together a timeline for these cold quasars.
What’s Up
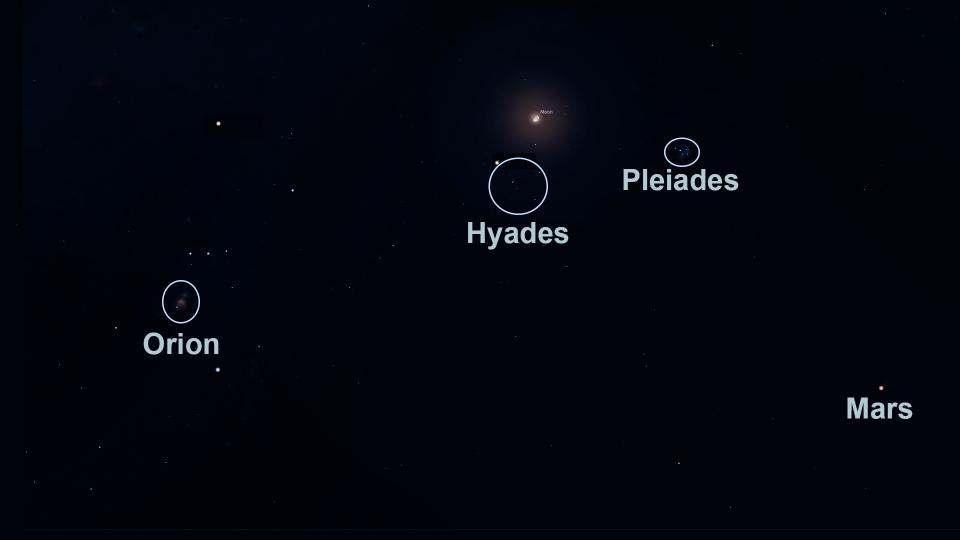
One of my favorite things to show people this time of year is the trio of the Orion nebula, the Pleiades, and the Hyades cluster. These systems are each snapshots in the evolution of open star clusters. While each of these systems is home to young stars, they are at very different developmental stages. Right now, the Moon is near these clusters and can help you find them, although it will also drown out some of their light.
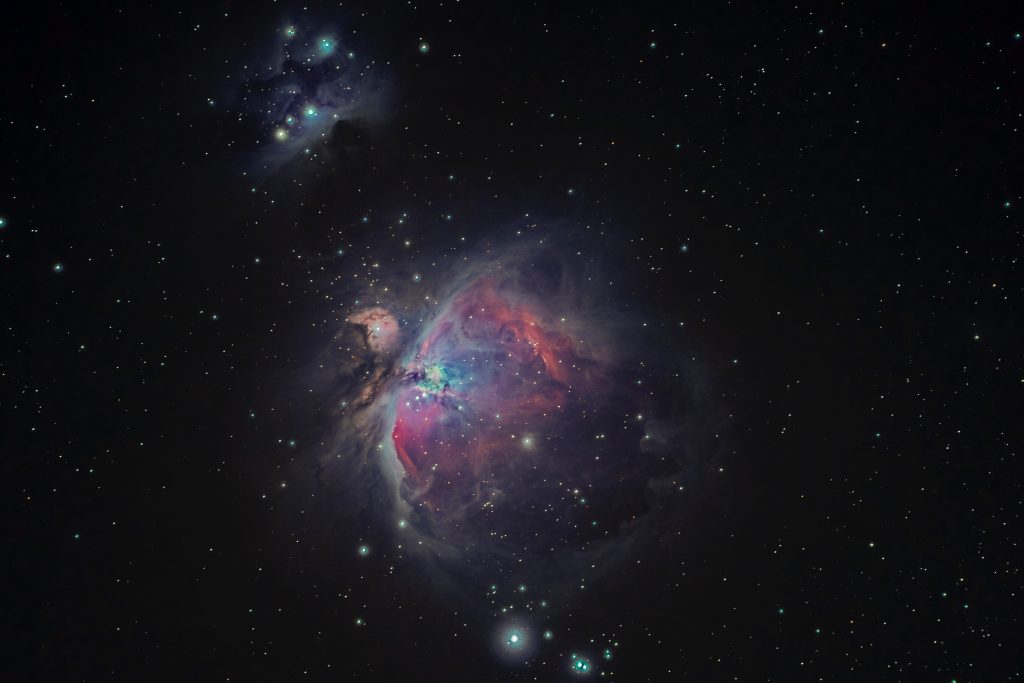
The Orion nebula is very much a stellar nursery, with stars just ten million years old or younger. It can be found in Orion’s sword and will be visible to the unaided eye in moderately dark areas. This cluster is so young that stars are still forming, and gas still glows around the tight cluster of stars. The Orion nebula is an easy target for cameras with a good zoom lens and a tripod, and the image we’re showing is a backyard photo by Bryan Goff.
If you want to see the next star cluster in our journey. draw a line from the bottom to the top of Orion’s belt and curve that line past the bright burnt orange Aldebaran, until you reach a tiny dipper of stars. This is not the little dipper; this is the Pleiades.
If the Orion nebula is a nursery, the Pleiades is more like a daycare center with stars 100 million years old or younger. There is very little gas and dust left in this system and star formation has come to an end, but the stars are still gathered in a distinct cluster on the sky. For those of us here in the northern hemisphere, this is the easiest to see a fuzzy object in the sky, in my personal opinion.
Our final cluster is the hardest to see because like teenagers with their drivers’ license, these stars have started to scatter to the wind. To find the Hyades, go back to burnt orange Aldebaran and notice how there are more stars in that region of the sky than in the surroundings. These are the stars you’re looking for!
Many of these stars have been shown to be moving together. The Hyades cluster is home to stars 730 million years old or younger and is basically dust- and gas-free. The reason this system appears so sprawled out is a problem of orbital mechanics. As this cluster goes around and around the Milky Way, stars on orbits closer to the center are moving faster, while those farther out are moving slower. This is stretching the system such that someday in the future, it will be nearly impossible to sort which stars were born together.
Our own Sun was born in a system that may have been like these clusters, and now we struggle to find our siblings. As alone as we are now, it’s kind of cool to know our Sun once grew up in a sparkling cluster with siblings of all sizes.
While you’re looking South at these clusters, also take a look at Mars. Here’s a neat thing to think about: while you can’t see them with your eyes or even with the best telescopes on Earth, that region of the sky contains a small fleet of spaceships, several of which will be landing in February. It’s time to start getting excited, folks. Al Amal, Percy, and Tianwen, we literally have our eyes on you. We just can’t actually see you.
This has been the Daily Space.
Learn More
Solar Activity Reconstructed Over a Millennium
- ETH press release
- “Eleven-year solar cycles over the last millennium revealed by radiocarbon in tree rings,” Nicolas Brehm et al., 2021 January 4, Nature Geoscience
Exploring the Solar Wind With a New View of Small Sun Structures
- NASA press release
- “Plumelets: Dynamic Filamentary Structures in Solar Coronal Plumes,” V.M. Uritsky et al., 2021 January 19, The Astrophysical Journal
Using Earthquake Forensics to Study Subduction from Space
- Eos article
Groundbreaking Analysis of Martian Glaciers Reveals Long History
- Colgate University press release
- “Surface boulder banding indicates Martian debris-covered glaciers formed over multiple glaciations,” Joseph S. Levy et al., 2021 January 26, PNAS
New Instrument Reveals Site of Planet Birth Near Young Star
- MPIA press release
- “The asymmetric inner disk of the Herbig Ae star HD 163296 in the eyes of VLTI/MATISSE: evidence for a vortex?“, J. Varga et al., to be published in Astronomy & Astrophysics
Massive Radio Galaxies Found With MeerKat Telescope
- Royal Astronomical Society press release
- “MIGHTEE: are giant radio galaxies more common than we thought?“, J. Delhaise et al., 2020 December 14, Monthly Notices of the Royal Astronomical Society
Cold Quasar Defines New Stage in Galaxy Evolution
- Science News article
- “Dying of the Light: Cold Quasars & The Shutdown of Galaxy Growth,” K.C. Cooke et al., 2021 January 11, American Astronomical Society Meeting
Credits
Written by Pamela Gay and Beth Johnson
Hosted by Pamela Gay and Beth Johnson
Audio and Video Editing by Ally Pelphrey
Content Editing by Beth Johnson
Intro and Outro music by Kevin MacLeod, https://incompetech.com/music/
 We record most shows live, on Twitch. Follow us today to get alerts when we go live.