
Media

Summary
Our coverage of last week’s AAS meeting continues with new work on the formation of planetary nebula based on Hubble Space Telescope images. Plus, a massive quasar in the early universe, water ice on Ganymede, a super-puff planet, and plans for taking spectra of Venus’ surface, featuring our guest, PSI scientist Dr. Darby Dyer.
Transcript
This is the Daily Space. I am your host, Dr. Pamela Gay.
And I am your host, Beth Johnson.
And we are here to put science in your brain. Today we’re going to be joined by a special guest, Dr. Darby Dyer, who will be talking about new research on Venus, but before that, let’s take a look at the news.
While the American Astronomical Society meeting is over, we still had new stories coming out after we recorded our episode on Friday, and today we start with one of them.
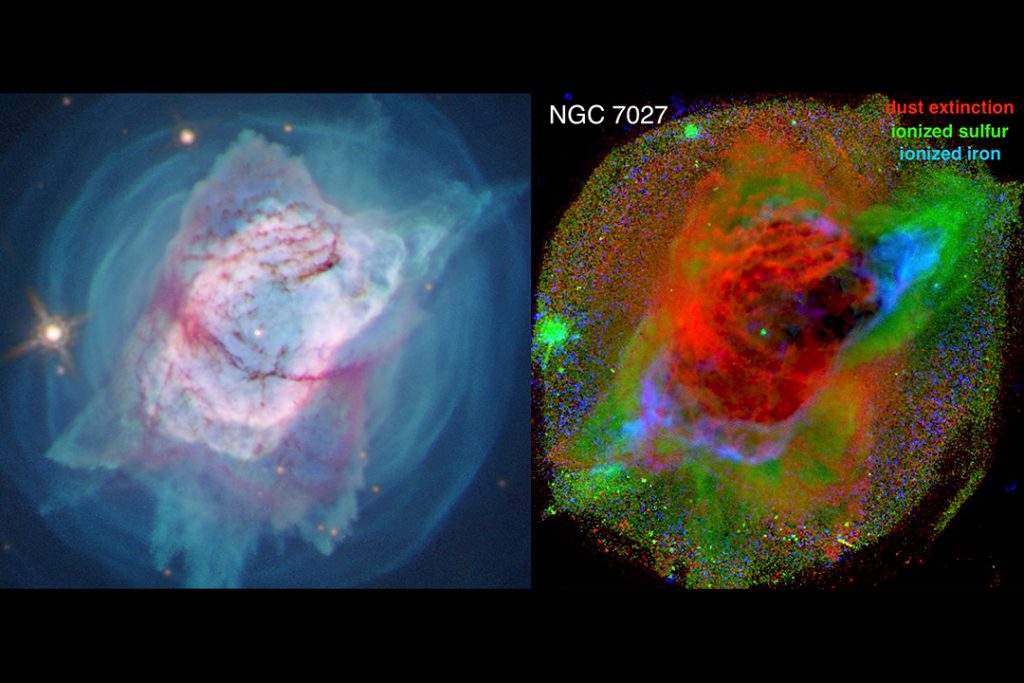
During a press conference, Rochester Institute of Technology’s Joel Kastner presented new research on the long-observed Jewel Bug Nebula. From a regular telescope on the ground, this remnant of a dying star looks like nothing more than a fuzzy bug-shaped blob, but even early Hubble (HST) images revealed an intricate structure of glowing gas and dust, and with each new camera upgrade,HST has revisited this system to see what new details could be resolved.
The Jewel Bug Nebula is what’s called a planetary nebula: a complex system of dust and gas that has been blown off of a dying star. Astronomers don’t entirely understand how these complex shapes form, but we do know that we’re dealing with the effects of a star exhaling its atmosphere in pulses and that material interacting with any companion stars or planets that may be in the system.
The Jewel Bug Nebula is estimated to be about 600 years old, or roughly the age of a vase from the Ming Dynasty. In this time, the material has been moving out and away from where a 1-8 Sun-massed star once shined, and as it moves away, it has been cooling. The core of the star, now a white dwarf, should still be in the center giving off bright UV light, but astronomers haven’t been able to see the stars inside this system, yet. What appears to be a star in the center is just a chance alignment of a random star between us and this nebula.
By looking to see where different kinds of gas and dust are visible, it becomes possible to map out the temperatures of the gas. The violet-appearing structures in the Hubble image, mapped in red in the not-very-pretty structural map on the right, is just dust which occurs where temperatures are coolest. Some of the brightest gas is hot-shocked material with ionized iron, and the remaining material is a more moderate temperature that can be mapped out by looking for ionized sulfur.
According to Kastner: We’re able to see the effect of the dying central star in how it’s shedding and shredding its ejected material. We’re now seeing where material that the central star has tossed away is being dominated by ionized gas, where it’s dominated by cooler dust, and even how the hot gas is being ionized, whether by the star’s UV or by collisions caused by its present, fast winds.
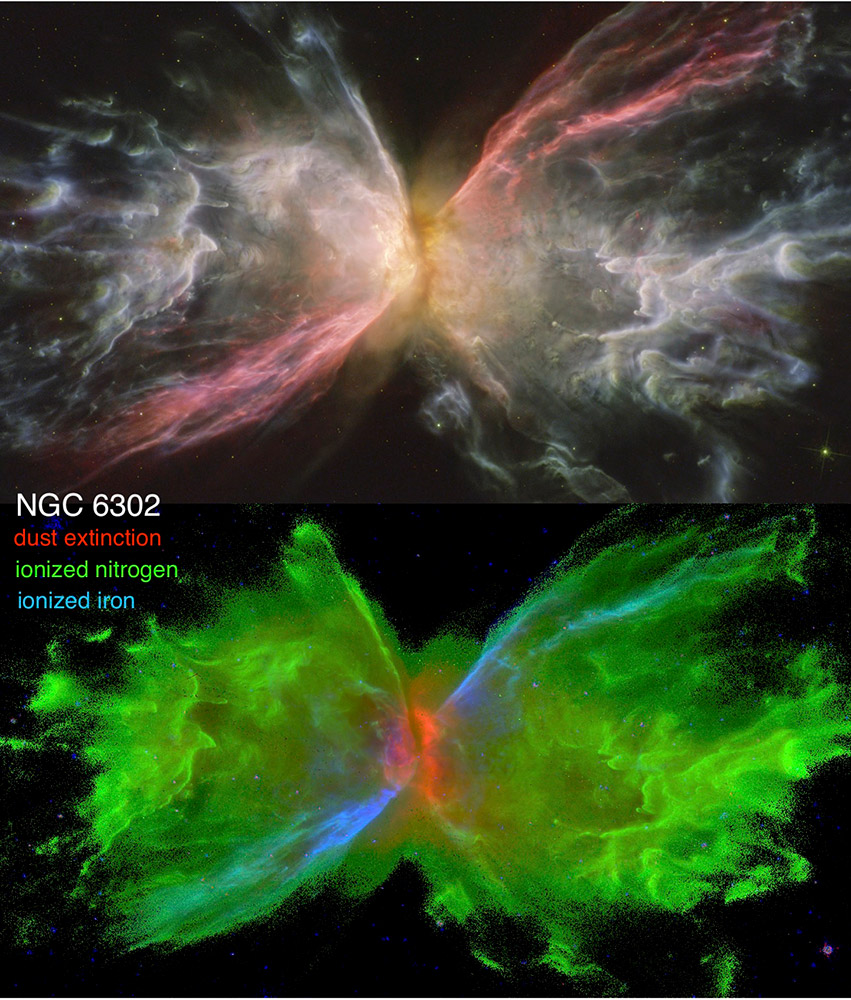
One of the most amazing and frustrating things about planetary nebulae is the variety of shapes they come in. In addition to viewing the Jewel Bug Nebula, Kastner and his team also observed the roughly 2000-year-old Butterfly Nebula. Both the systems are thought to have binary stars in their core, and it is possible that the reason they look so remarkably different is simply viewing angle. In this system, the narrow body of the butterfly is the dust, and hot ionized iron traces the top of the right wing and the bottom of the left. The object isn’t flat, however, and the butterfly is more like an hourglass viewed edge-on, while the Jewel Bug is more like a really warped hourglass viewed from the top down.
What was presented at AAS is only the beginning of this research, and we look forward to seeing more nebulae analyzed and a longer research paper in the future. When those come out, we’ll bring them to you here.
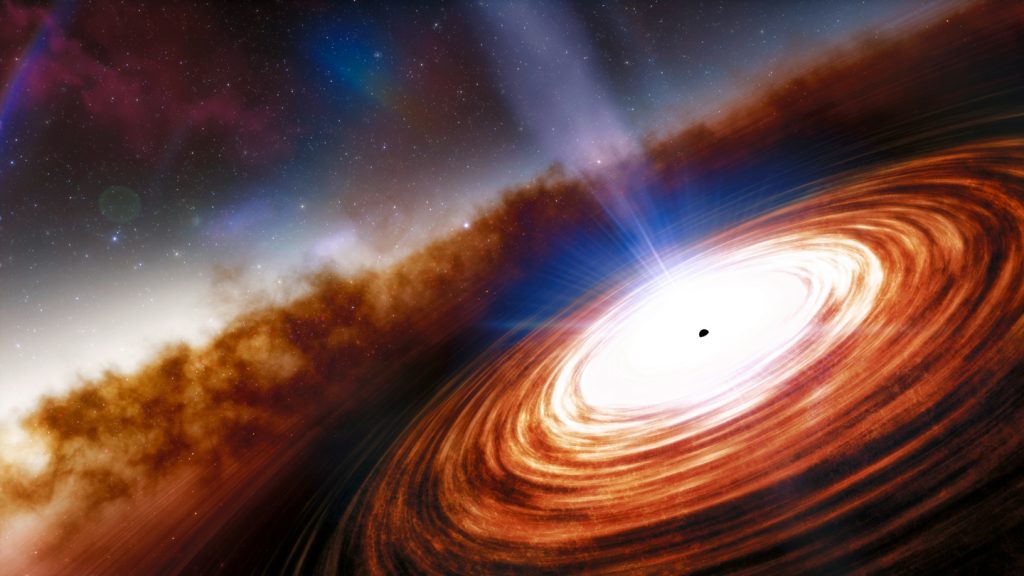
In what may be our final story from the AAS meeting, we’d like to share the discovery of one of the earliest forming massive galaxies in our universe. Cataloged with the phone number J0313-1806, this object was detected in part from the DESI survey, which we discussed last week. This object now holds the record for the most distant galaxy ever seen, and its light has been traveling to reach us for more than 13 billion years. The only reason we can see this system is it is truly massive in just about every way.
This system has a huge supermassive black hole that is 1.6×10^9 solar masses, or a thousand times larger than the supermassive black hole in our own Milky Way galaxy. The system is undergoing massive amounts of star formation and is creating two hundred stars per year, compared to our own galaxy’s roughly one star per year. It’s an amazing system, and to be entirely honest, it is also totally unexpected.
In order to get a system this big, either massive amounts of material had to collapse all at once to form that supermassive black hole and galaxy, or stellar-mass black holes needed to form and then merge at a rate we didn’t think was possible. According to lead study co-author Xiaohui Fan: We have to look much earlier [in the universe] and look for much less massive black holes to see how these things grow.
This kind of research may require the JWST, so here is to hoping it can finally get off the ground later this year. This work will appear soon in The Astrophysical Journal Letters and was led by Feige Wang of the University of Arizona.
Now we have some good news for all you particle physics junkies. It looks like the axion may just be starting to reveal itself in unusual flashes associated with nearby neutron stars. A favorite of sci-fi authors and showrunners, these particles were theorized in the 1970s as one of the fundamental particles of our universe. If they exist, they have mass and might be part of the hidden dark matter that makes up so much of the universe. They also have this neat predicted property of converting into light in the presence of a strong magnetic field.
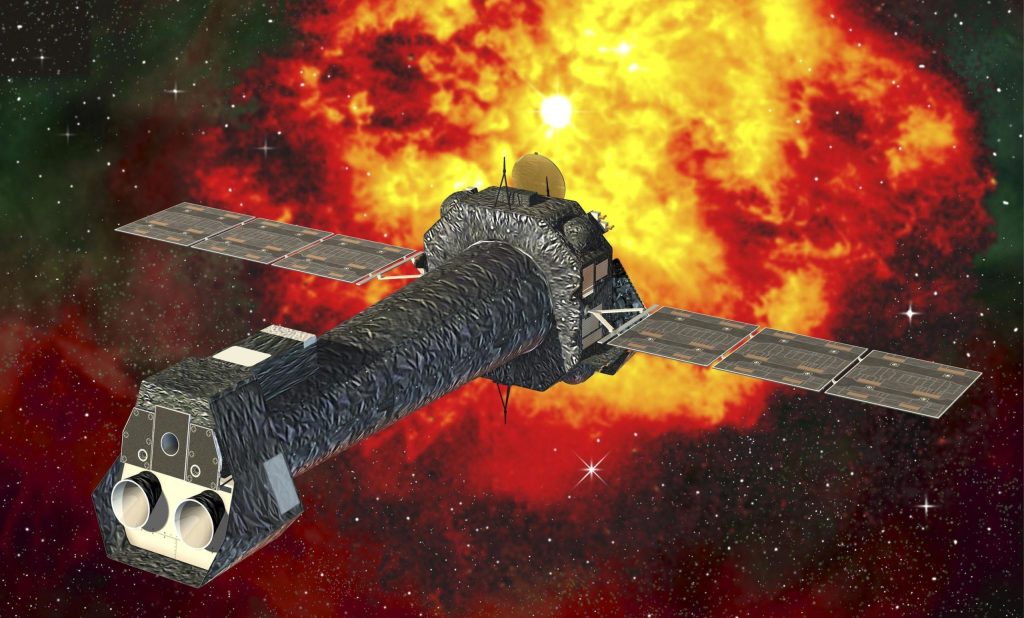
Well, some of the strongest known magnetic fields are associated with neutron stars, and there are seven young, not-too-distant neutron stars in utterly boring regions of space that have excess X-ray light that can’t be explained by anything other than axions… or unknown physics. This X-ray light was seen in both the Chandra and XMM-Newton X-ray telescopes.
According to study co-author Raymond Co: We’re not claiming that we’ve made the discovery of the axion yet, but we’re saying that the extra X-ray photons can be explained by axions. It is an exciting discovery of the excess in the X-ray photons, and it’s an exciting possibility that’s already consistent with our interpretation of axions.
This work is published in the journal Physics Review Letters and is led by Malte Buschmann. No matter how it turns out – new physics or axions – this is exciting news, even if it does break the brain a little.
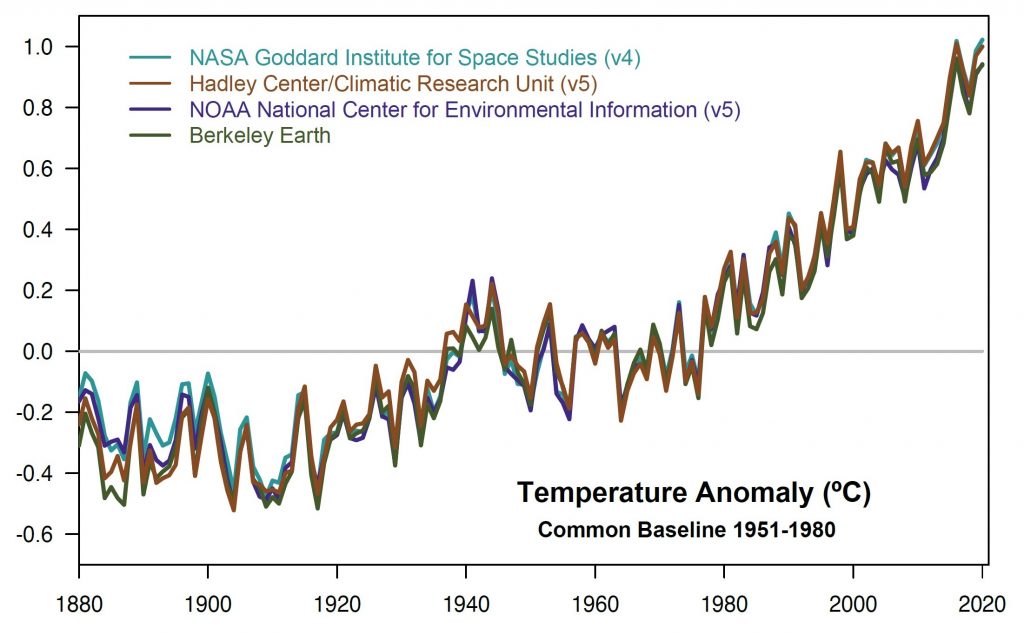
With the start of each new year, we start hearing reports on how the twelve months we just completed stack up against all the cycles of twelve months that came before. One of the more unfortunate metrics that has been in the news in our Earth’s temperature. According to newly released NASA data, 2020 was tied with 2016 as the warmest year on record and was on average 1.8 degrees Fahrenheit or 1.02 degrees Celcius warmer than the baseline from 1951 to 1980.
There are a lot of ways for a world to be warmer on average and some places will see a change of more than just one degree. What we’re observing is that some places are several degrees warmer while others are a couple of degrees cooler, and where those warmer and cooler places are located really matters. When it’s the ocean that gets heated, we see bigger hurricanes and more melting sea ice.
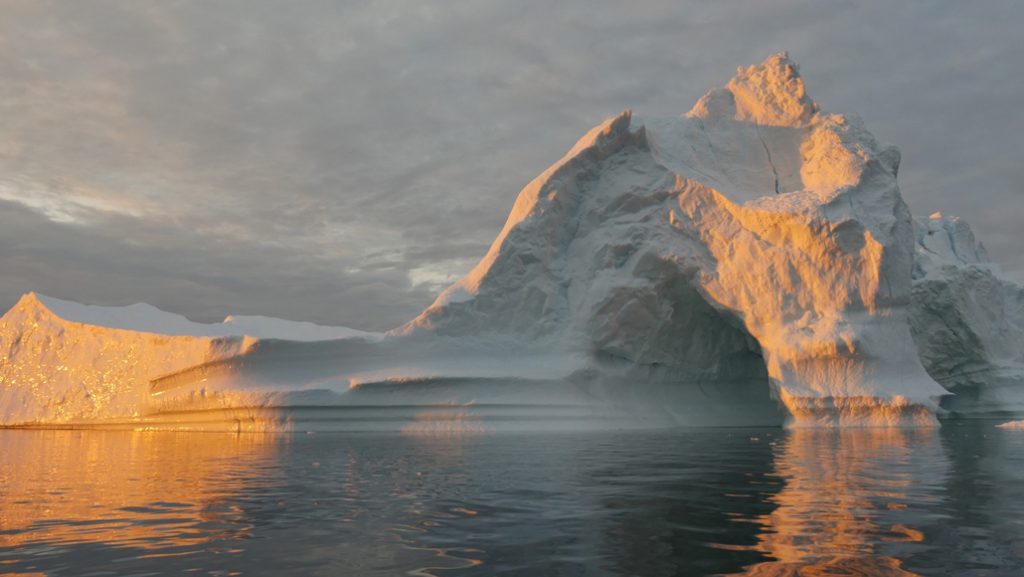
It’s hard to fathom how much energy the ocean can store. In 2020 alone, it is estimated the oceans absorbed enough heat to boil between 65 million and 1.3 billion kettles of water, depending on the model the scientists use and the size of your kettle. We saw that energy shaping our world with the accelerated melting of Greenland’s glaciers and Antarctic ice and the supercharging of tropical storms.
Currently, a massive piece of the Antarctic Larsen Ice Shelf is grinding toward South Georgia Island, which is home to penguins, sea lions, and a multitude of critters that must have access to open water to find food. There is significant concern that as this melting iceberg tries to make landfall, it could block access to the ocean for these animals. It’s hoped it will run aground far enough out to leave access to the sea, but right now, all we know for certain is that rising temperatures are reshaping our world as ice moves, storms change our coastlines, and the habitats for plants and animals move poleward.
As exciting as it is scientifically to see a world so rapidly changing, this is all so much to understand as someone who lives on this changing planet. If we don’t want to see more radical changes, we – all humans on this planet – are going to need to do our best to reduce the release of greenhouse gases. Our individual choices matter, but the biggest impacts come from industrial pollution, and with the U.S. expected to rejoin the Paris Agreement on Wednesday, it is easier to hope that we can succeed in reducing the rate at which the world’s temperatures will rise.
Thank you for ending that story on a hopeful note, Pamela.
From the woes of Earth, we head out to Jupiter to talk about the largest moon in our solar system, Ganymede. I’ve talked about Ganymede quite a bit recently, especially if you watched our Minecraft Monday show back in December. We added a few features onto Ganymede in our Minecraft solar system based on the research of the past few years, including an atmosphere with aurorae and a subsurface ocean.
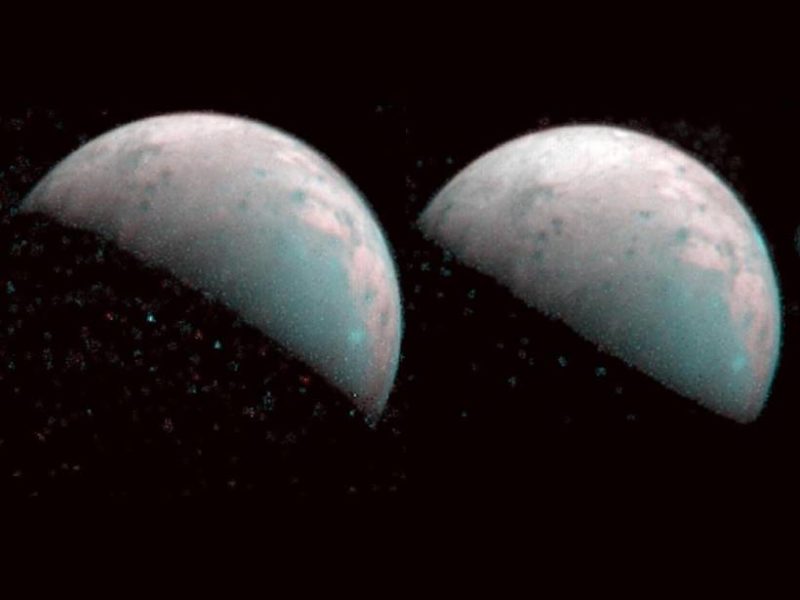
Yes, Ganymede is another icy world, and new research published in the Journal of Geophysical Research: Planets uses data collected from NASA’s Juno Mission to evaluate some of that ice. The team involved used the Jovian Infrared Auroral Mapper (JIRAM) to take images and spectra of Ganymede. In particular, they looked at the north polar region. Juno was about 100,000 kilometers away, so JIRAM was able to map at an impressive resolution of 23 kilometers per pixel. From a collection of images taken at various angles, researchers compared the different brightness levels and the illumination geometry and developed a model for the surface reflectance. They also extended the current map of global water ice to these polar regions.
The biggest result from this paper is the discovery that there are likely larger ice grains in relatively fresh craters, a result that needs further explanation. Lucky for us, we told you last week that NASA extended the Juno mission, and Ganymede is going to be on the receiving end of more flybys that will be even closer. We’re excited to see where this research leads.
Jupiter is definitely the Big Planet on Campus here in our solar system, what with that huge moon and its own significant size. But in the wider galaxy, Jupiter is a small fish in a big pond. And it’s not even the most interesting Jupiter-sized planet in that big pond!
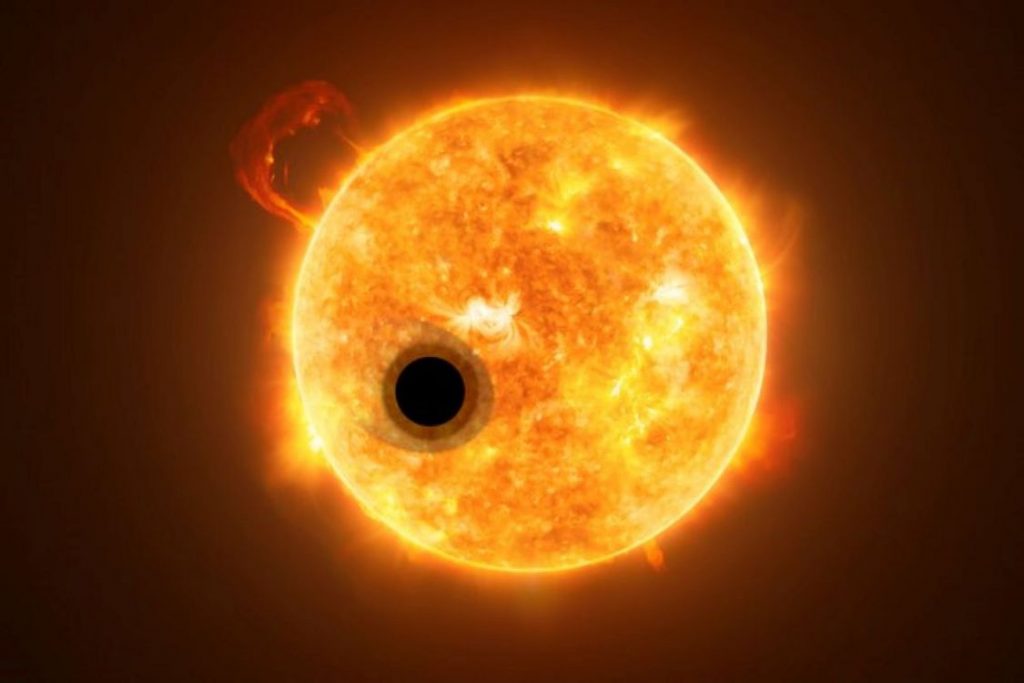
In a new paper appearing in The Astronomical Journal, a team led by Caroline Piaulet presents the discovery of a puffed up planet. Roughly the size of Jupiter, the world has ten times less mass than Jupiter. It’s basically just a lot of hot gas with a less than 4.6 Earth-mass core.
It is thought that it normally takes significantly more mass in the core for a planet to gravitationally pull in enough material to be this big. This object has been cataloged as WASP-107b and has been dubbed a super puff or cotton candy planet. Co-author Bjorn Benneke states: This work addresses the very foundations of how giant planets can form and grow. It provides concrete proof that massive accretion of a gas envelope can be triggered for cores that are much less massive than previously thought.
It’s unclear if the team has considered any other ways of getting a puffed-out planet than forming it that way; this is after all a discovery paper saying, “Hey, look at what we found.”
I have to admit, this work reminds me of a paper last year that pointed out that Jupiter’s core is fluffier than expected, probably because of a collision between Jupiter and an earlier proto-planet. That paper has me wondering if you can get really fluffy planets with bigger collisions. I can’t wait to see what theorists do with this discovery.
Last week, our home institution of the Planetary Science Institute (PSI) sent out a press release about a trio of papers about Venus, including one that was published in Science Advances on Friday. The other two papers were published in the journal Icarus and in Geophysical Research Letters. PSI’s Darby Dyer is the lead author on those last two and a co-author on the Science Advances paper.
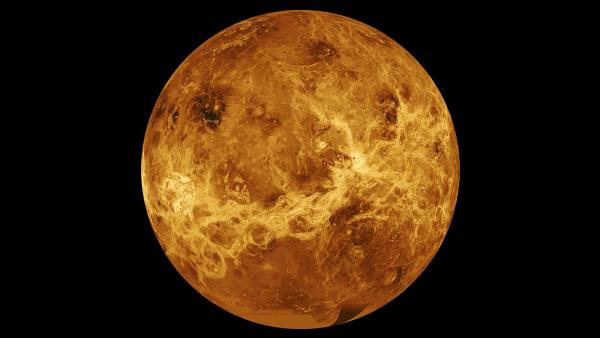
Here are the basics: Venus is covered in very thick clouds of carbon dioxide. This cloud layer makes it incredibly difficult to get any information about the surface of the planet, as most visible and near-infrared light cannot penetrate, so we cannot get spectra of the rocks on the surface. A few Soviet landers managed to acquire some data back in the 1970s, and the Magellan mission obtained some radar data.
It’s not a completely hopeless situation, however. There are some tiny windows in the near-infrared at about one micron that can penetrate the thick clouds. So let’s send an orbiter! But wait. The question then becomes how will we know if the data we acquire through those windows with that expensive orbiter is accurate when we’ve not sampled data in this fashion before. Laboratory work to the rescue.
Dr. Dyer worked with a team out of the German Aerospace Center Institute of Planetary Research to set up a Venus chamber, where they could work with rocks in a similar high-temperature environment to that of Venus and acquire spectra. These spectra made it possible to understand what the composition of a variety of igneous rocks would look like as sampled by a Venus orbiter. The data was compared to spectra taken with those same Soviet landers and found to be a match.
Now we can plan for missions like VERITAS and ESA’s EnVision to include instruments that can perform the six-wavelength spectroscopy tested in the lab. And we can even set up machine learning algorithms in advance to analyze the data from orbit since we already have a dataset to compare to. Very exciting prospects indeed.
And now we’re joined by Planetary Science Institute Senior Scientist Dr. Darby Dyer. Dr. Dyer, thank you so much for joining us today. Did I summarize the work properly?
[interview with Dr. Dyer]
Once again, thank you, Dr. Dyer, for joining us today.
This has been the Daily Space.
Learn More
Anatomical Dissection of Planetary Nebula Using Hubble Images
Ancient, Massive Black Hole Found
- The University of Arizona press release
- NOIRLab press release
- Keck Observatory press release
- “A Luminous Quasar at Redshift 7.642,” Feige Wang et al., to be published in Astrophysical Journal Letters (preprint on arxiv.org)
Traces of Long-Sought Axion Particle Potentially Found
- Berkeley Lab press release
- “Axion Emission Can Explain a New Hard X-Ray Excess from Nearby Isolated Neutron Stars,” Malte Buschmann et al., 2021 January 12, Physical Review Letters
Climate Change: 2020 Tied for Warmest Year on Record
- NASA press release
- Science News article
- “Upper Ocean Temperatures Hit Record High in 2020,” Lijing Cheng et al., 2021 January 13, Advances in Atmospheric Sciences
Juno Maps Water Ice at Northern Pole of Ganymede
- Eos article
- “Infrared Observations of Ganymede From the Jovian InfraRed Auroral Mapper on Juno,” A. Mura et al., 2020 November 4, Journal of Geophysical Research: Planets
WASP-107b Turns Out to be Super-Puff the Size of Jupiter
- University of Montreal press release
- “WASP-107b’s Density Is Even Lower: A Case Study for the Physics of Planetary Gas Envelope Accretion and Orbital Migration,” Caroline Piaulet et al., 2021 January 18, The Astronomical Journal
Spectroscopic Windows Could Lead to Map of Venusian Surface
- PSI press release
- “Deriving iron contents from past and future Venus surface spectra with new high-temperature laboratory emissivity data,” J. Helbert et al., 2021 January 15, Science Advances
- “Surface weathering on Venus: Constraints from kinetic, spectroscopic, and geochemical data,” M. Darby Dyar et al., 2020 October 6, Icarus
- “Probing Venus Surface Iron Contents With Six‐Band Visible Near‐Infrared Spectroscopy From Orbit,” M. D. Dyar et al., 2020 October 29, Geophysical Research Letters
Credits
Written by Pamela Gay and Beth Johnson
Hosted by Pamela Gay and Beth Johnson
Audio and Video Editing by Ally Pelphrey
Content Editing by Beth Johnson
Intro and Outro music by Kevin MacLeod, https://incompetech.com/music/
 We record most shows live, on Twitch. Follow us today to get alerts when we go live.