
Today we look at a trio of climate change stories, which are mostly bad news, although one study has discovered that African lakes are doing more sequestering of greenhouse gases than emissions. Plus, the CAPSTONE launch, meteorite crystals, and this week in rocket history, a mission that launched… but failed.
Podcast

Show Notes
Meteorites contain exotic carbon molecules
- Exotic carbon microcrystals in meteorite dust (EurekAlert)
- SETI Institute press release
- “Exotic carbon microcrystals in meteoritic dust of the Chelyabinsk superbolide: experimental investigations and theoretical scenarios of their formation,” Sergey Taskaev et al., 2022 May 7, The European Physical Journal Plus
- “Detection of Cosmic Fullerenes in the Almahata Sitta Meteorite: Are They an Interstellar Heritage?“, Hassan Sabbah et al., 2022 May 27, The Astrophysical Journal
Canary Island eruption devastating due to viscosity
- JGU press release
- “Eruption of ultralow-viscosity basanite magma at Cumbre Vieja, La Palma, Canary Islands,” Jonathan M. Castro and Yves Feisel, 2022 June 8, Nature Communications
- Behind the Paper: Eruption of ultralow-viscosity basanite magma at Cumbre Vieja, La Palma, Canary Islands (Nature)
Rocket Lab Electron launches spacecraft to the Moon
- NASA press release
The rise of AI & rising temperatures
- McGill University press release
- “Aligning artificial intelligence with climate change mitigation,” Lynn H. Kaack et al., 2022 June 9, Nature Climate Change
Drought conditions on the rise
- In the near future, unprecedented drought conditions are projected to be more frequent and consecutive in certain regions (EurekAlert)
- “The timing of unprecedented hydrological drought under climate change,” Yusuke Satoh et al., 2022 June 28, Nature Communications
African lakes sequestering carbon dioxide
- University of Liège press release
- “Greenhouse gas emissions from African lakes are no longer a blind spot,” Alberto V. Borges et al., 2022 June 24, Science Advances
This Week in Rocket History: CONTOUR
- CONTOUR (NASA)
- Contour (Comet Nucleus Tour) (Aerospace Technology)
- Contour Mishap Board Completes Investigation (NASA via Web Archive)
Transcript
This episode is a real downer — climate change and its impacts like more drought.
At least we have some new ways of trying to mitigate it, like AI.
And for goodness and light, there are pretty space rocks with interesting structures.
And we have rocket launches, both present and past. This week in rocket history is CONTOUR, a spacecraft that tried, but did not get very far.
All of this now, right here on the Daily Space.
I am your host Dr. Pamela Gay.
I am your host Erik Madaus.
And we’re here to put science in your brain.
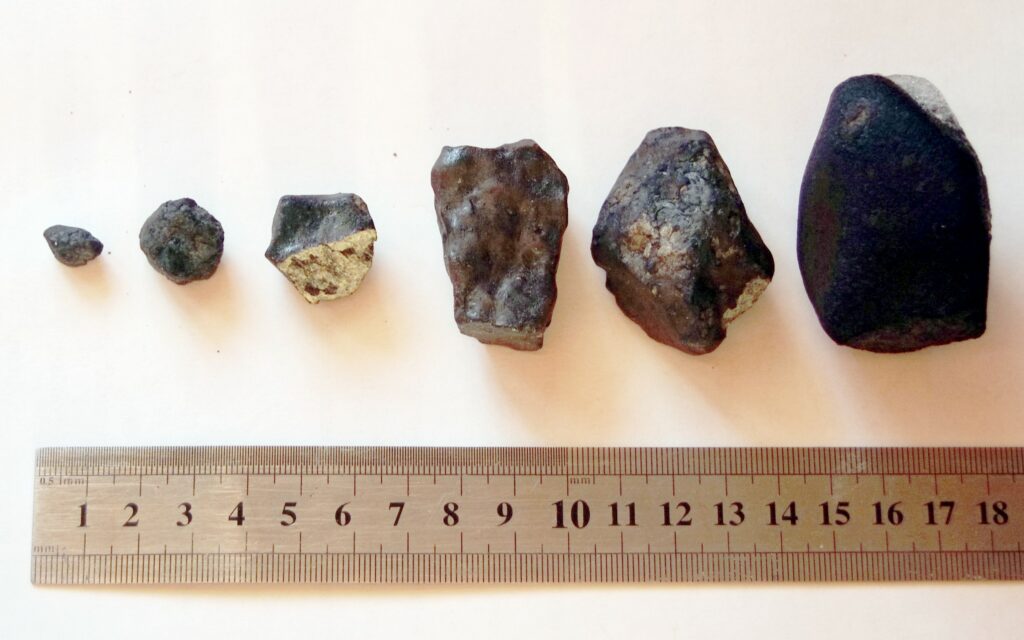
Back in 2013, on Valentine’s Day, the Internet was fascinated with videos of a fireball entering the atmosphere over Chelyabinsk, Russia. The meteor appeared out of nowhere, approaching from the Sun side during the day, previously unseen by astronomers. And when the meteor hit the atmosphere, it caused a sonic boom and shock wave that fragmented the approximately 20-meter rock and shattered windows throughout the town.
And there were massive amounts of footage of the event from many different angles thanks to the saturation of dashboard cameras in the region. Which turned out to be incredibly helpful for the scientists who wanted to hunt down the fragments.
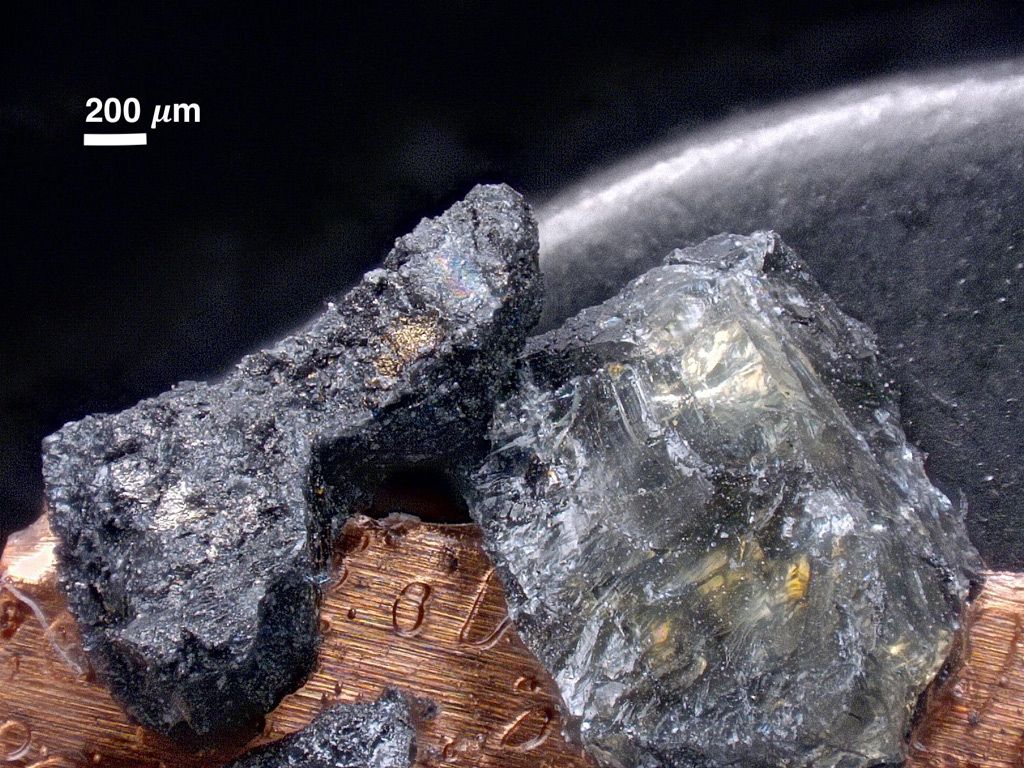
Now, in a new paper published in The European Physical Journal Plus, scientists have published results on an analysis of the dust that coats those meteorites. This dust forms on the surface when the meteor is exposed to high temperatures and pressures upon entry into the atmosphere. And since these particular fragments landed in snow and ice, that dust ended up preserved on the surface.
Using scanning electron microscopy, the researchers found some unusual crystals – closed, quasi-spherical shells and hexagonal rods. And they turned out to be made of carbon formed when graphene layers built up on carbon nuclei. The team theorizes that these molecules could be buckminsterfullerenes – Buckyballs – made of 60 carbon atoms.
And with another new paper published in The Astrophysical Journal with lead author Hassan Sabbah, another meteorite has actually revealed the presence of Buckyballs in a meteorite for the first time. That meteorite is called Almahata Sitta, and it was discovered in 2008 by a team of scientists and volunteers tracking the fragments based on radar data – also a first in the field of meteorites.
This particular set of meteorites originated from a previously unknown asteroid now cataloged as 2008 TC3, and many of the pieces turned out to be ureilites. Ureilites are rather exotic in the meteorite world as they are bits of the mantle of partially melted, carbon-rich asteroids. That means they are fairly primitive pieces of our early solar system.
And using a mass spectrometer called Astrochemistry Research of Organics with Molecular Analyzer or AROMA, the team made what is being called the “first unambiguous detection in a meteorite of buckminsterfullerenes and other fullerenes.” To confirm the unique discovery, scientists also performed the same analysis on two other primitive meteorites and found no evidence of fullerenes.
Despite the theory about the Chelyabinsk meteor and its potential fullerenes, the team, in this case, disputes the re-entry origin theory, as co-author Cyrena Goodrich notes: Although this was a high-temperature event, it was still not hot enough to have created fullerenes from pre-existing carbon phases.
So it could be that this asteroid had an interstellar origin, somewhere close to a massive star in the molecular cloud of formation. But we’ll need more data and evidence to prove that origin story, a task that could be performed by JWST in the coming years.

Meanwhile, in more Earth-centric science, scientists have been analyzing the eruption of the Cumbre Vieja volcano last year which was one of the volcanic eruptions that fascinated us all during the lockdown. Honestly, as far as eruptions go, particularly on the non-explosive side, this particular eruption caused a massive amount of damage, destroying more than 1,600 structures.
However, because scientists were paying attention, evacuations happened quickly and early, with no deaths recorded as a result of the eruption. Still, the overwhelming destruction gave scientists pause, and since the eruption stopped in December, analysis has been ongoing to understand the mechanics involved.
In a new paper published in Nature Communications by Jonathan M. Castro and Yves Feisel, research into the conditions of the eruption shows that the lava was far less viscous than expected. The lava’s temperature range was around 1,200 degrees Celsius and was ten times less viscous than the 2018 eruption of Kilauea in Hawaii. This high fluidity was due to a very low silicon content in the melt, which caused the lava to pour out at ten meters per second. That made for impressive webcam footage but also for a high level of destruction.
This research can be used to predict where and how a volcanic eruption may vary over time under similar conditions, which will continue to improve our ability to save lives and maybe even prevent destruction.
And now, here’s Erik with a rocket launch.

On June 28 at 09:55 UTC, a Rocket Lab Electron/Lunar Photon launched NASA’s CAPSTONE spacecraft from Launch Complex-1 on the Mahia peninsula in New Zealand.
The NASA co-host was in Florida, set up in front of the SLS rocket still at 39A, which I thought was pretty interesting. There were none of the usual onboard cameras because of the need for more telemetry bandwidth, but the animation replacing it was very well done.
The launch was completely successful, and Lunar Photon will burn six times over the next six days to raise CAPSTONE towards the Moon. After those burns, CAPSTONE will take four months to reach the Moon on its ballistic capture trajectory. Once there, the spacecraft will perform its mission by evaluating the Near Rectilinear Halo Orbit, the special orbit that the Gateway station will use.
You can follow along on CAPSTONE’s long journey using NASA’s Eyes on the Solar System, a web app made by the Jet Propulsion Laboratory. We’ll have a link to it in our show notes for this episode.
And now for some climate change research.
One of the problems with science and technology is we don’t always understand the full consequences of what we discover until it’s too late. Coal power revolutionized the world and also defaced buildings with soot, damaged lungs, and altered how our atmosphere insulates our world.
Modern technology can have even more far-reaching implications. Blockchain offers new ways to store and hide information, generate currency, and commit crimes, and the tech required releases heat, consumes massive amounts of energy, and can cause people to lose fortunes with a one bad power surge or insecurely typed password.
Both coal and blockchain technology only have so many applications. Blockchain isn’t going to revolutionize refrigerator technology, and coal isn’t going to offer solutions to the automotive industry. These limitations are something of a blessing because they limit how much damage these technologies can do.
Not all advances are so compartmentalized. The internet has spanned the internet of things, and with this new “how do I connect my bathroom scale to wifi” reality is coming a second wave of revolution in artificial intelligence.

And according to a group of researchers published in Nature Climate Change and led by Lynn Kaack, this new revolution has mixed implications for our planet, and we need to take care to balance the scales so the good outweighs the bad. Per the press release: The paper divides the impacts of AI on greenhouse gas emissions into three categories: 1) Impacts from the computational energy and hardware used to develop, train, and run AI algorithms, 2) immediate impacts caused by the applications of AI – such as optimizing energy use in buildings (which decreases emissions) or accelerating fossil fuel exploration (which increases emissions), and 3) system-level impacts caused by the ways in which AI applications affect behavior patterns and society more broadly, such as via advertising systems and self-driving cars.
Put another way, every time you ask, “Why does my bathroom scale need batteries?”, we are expending energy in a new way that satiates our need for the best possible data, but that may not benefit the planet. At the same time, every time we ask, “Why does my AC unit need to be on the internet?”, we may be creating a reality where our house can adjust the temperature to conserve energy whenever we aren’t home.
One of the frustrating things is this is going to be driven by capitalism rather than climate science. If it is cheap and easy to track my face, custom advertising will be the norm, and those Sorel slippers Google ads are trying so hard to sell me won’t just follow me around the web, they will follow me around the real world as bus stop ads and billboards change to determinedly try and convince me I need warm, furry goodness next to my feet. And with every ad, a little more power is used, and a little more of my willpower to not buy slippers is worn down, until I cave and buy the slippers, increasing consumption and causing the ads to flip to the next item the algorithm has decided I need to buy.
I don’t want that future. I just want smart heating and cooling that tracks how our house is used and optimizes the heating and cooling to match room use.
We can only hope that the savings from smart temperature control will save enough money that their energy savings (and the energy savings of similar devices) will be more lucrative than smart ad-generated sales. It may be a false hope, but today I’m going to choose hope.
And I’m not going to give in to the temptation to buy those slippers.

In addition to smart thermostats and smart ads, we also need smart agriculture that can combine weather forecasts, soil and air sensor readings, and other data to help farmers know when they must water and do other tasks to help their farms keep producing in a world of droughts and increasing famine.
In a new paper in Nature Communications, researchers led by Yusuke Satoh look at how places we normally see as lush are likely to face unprecedented levels of drought in the coming decades. Using computer models that considered futures with various levels of greenhouse gas emissions, they studied how rainfall & water distribution via rivers will change over time, and they found trends toward severe drought in three regions: Southwestern South America, Mediterranean Europe, and Northern Africa.
In their simulations, they found that climate change won’t affect every place the same. Some areas will face little change, while others will become hotspots of multi-year droughts that exceed what has been seen in the past 141 years.
No lies — I and many of my friends have looked at climate models before deciding where on the planet we wanted to live.
These changes are expected to start impacting our world in the next fifty years. This is our future.
As a scientist, I know more about climate change than I want to, and when reading about the real world gets my head in a bad place, I tend to escape into books. A few years back, I heard a review on the radio for a book that had as one of its plot points the release of a massive amount of carbon dioxide (CO2) from a lake and how it killed a large number of people. While that sounds terrible, the book sounded awesome, but because I was driving I didn’t write down its name. I still want to read that book, and I’m thinking about it now because, in the middle of all of today’s ugly science, there is a story on carbon dioxide and methane release from African lakes.
[If you know the name of the book, please let me know. I’m at starstryder with a y on Twitter. 🙂 ]
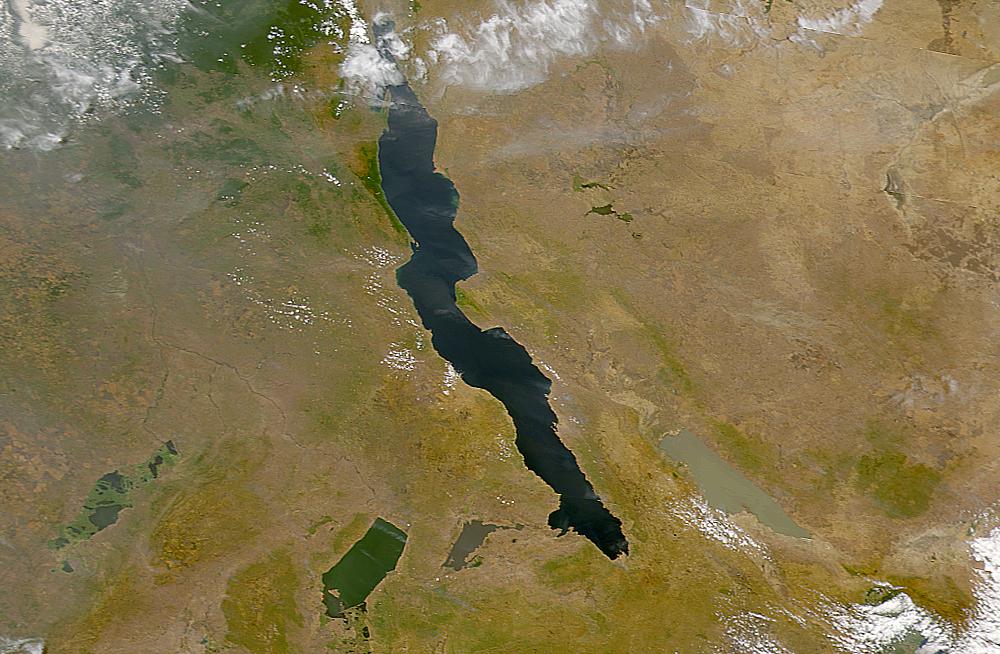
As for the science, in a new paper in Science Advances that is led by Alberto Borges, researchers look at the natural creation and release of these greenhouse gases in lakes by algae. While a lot of research has been done to understand the carbon cycle in the oceans, the same data hasn’t been collected for the majority of the world’s lakes. We lack an understanding of how lakes sequester carbon into life and release it through that life’s respiration.
Data we have from North American and Scandinavian lakes allow for estimates, but a lake in Finland is going to be very different from a lake in the Congo. In their work, this team measured the actual emissions of lakes in Africa, and according to Borges: The micro-algae that make up the phytoplankton are very fond of the warm and luminous conditions of the tropical ‘endless summer’ which means that some of the African lakes that we have studied are extremely productive. However, through photosynthesis, phytoplankton remove CO2 from the water, and these lakes, therefore, sequester CO2 in the form of organic matter buried at the bottom of the lakes in the sediments. They, therefore, act as carbon sinks, whereas until now it had always been assumed that lakes emitted CO2 in very large quantities into the atmosphere, as do boreal lakes.
Now, there are plenty of volcanic lakes that emit CO2 (that’s what was happening in that novel I want to read), but all those non-volcanic lakes – the majority of the lakes – are one small bright spot that are taking in more greenhouse gasses than they are releasing.
Celebrate slimy lakes full of algae people. That algae is our future.
Next up, let’s look at a spacecraft that failed spectacularly and celebrate what we can learn when things go sideways.
This Week in Rocket History
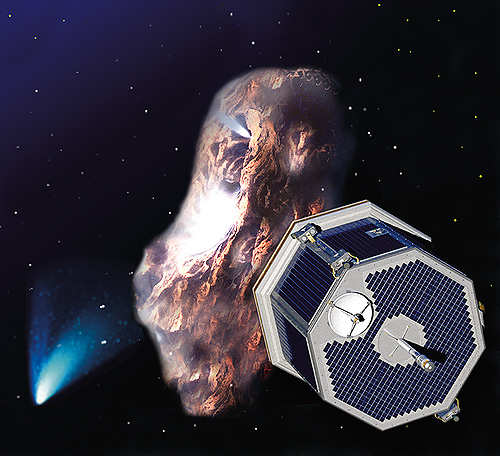
This Week in Rocket History, we look at the CONTOUR spacecraft that promised much but never actually got to fulfill its potential.
CONTOUR was the sixth in NASA’s Discovery Program, a medium-cost and medium goals program that has spawned missions from Mars Pathfinder to Dawn and InSight. CONTOUR or COmet Nucleus TOUR was designed to fly through the tails of at least two comets, including Comet 73P/Schwassmann–Wachmann, which produced the Tau Herculid meteor shower earlier this year, and Comet 2P/Encke, which we talked about in a What’s Up segment a couple of months ago. CONTOUR’s primary mission was expected to last until June 2006, with a possible third target, Comet 6P/d’Arrest, leading to a 2008 mission extension.
The spacecraft design was simple and had very few moving parts except for one science platform. The antenna was a passive omnidirectional design. These design choices reduced costs and made the spacecraft more reliable, at the cost of being able to send back less data.
The spacecraft had a multi-layer Kevlar and metal Whipple shield since it would be intentionally sent into the high debris environment of a comet’s nucleus.
Just over 30 kilograms of the spacecraft’s 970-kilogram mass was science instruments. The CONTOUR Remote Imager/Spectrograph, or CRISP, was a 1000-by-1000 pixel sensor sensitive to light between 450 and 770 nanometers. The spacecraft also had a spectrograph, sensitive to longer wavelengths of light but at a much lower resolution of 256-by-256 pixels in color and spectra. This would have produced 100 meters per pixel resolution color images of each of these comet nuclei and also measured their spectra as CONTOUR passed within 100 kilometers of them.
Other instruments included the Comet Impact Dust Analyzer and the Neutral Gas Ion Mass Spectrometer, which would have worked together to measure the comets’ chemistry by measuring the number of different isotopes of elements in the comets’ comas. Dust impact data would have completed the picture and allowed different comets to be compared for the first time.
CONTOUR was launched on a Delta II 7425-9.5 on July 3, 2002, at 06:47 UTC, from Cape Canaveral Air Force Station. The rocket had four solid rocket boosters and used a Star-48 third stage, with a 9.5-foot diameter fairing. The 9.5-foot fairing is the classic shape used on all of the GPS II launches on Delta IIs, and also many other iconic science missions like the Spirit and Opportunity Mars rovers.
The Delta II lifted CONTOUR into a high apogee Earth orbit, where it was to perform further 23 maneuvers over 43 days to line itself up for the comet rendezvous.
The first major operation came six weeks after launch when CONTOUR fired its solid motor to leave Earth orbit at perigee. The burn was to set up an Earth flyby before visiting Comet Encke. After visiting Encke, it would have done two more Earth flybys before visiting Comet 73P. However, something happened to the motor, and contact with CONTOUR was never re-established. Later, radar tracking detected several pieces of debris in the expected area of the spacecraft. NASA attempted to contact the spacecraft until December 2002, when the mission was declared lost.
An investigation concluded that the spacecraft likely suffered a structural failure during the burn, either due to a malfunction with the motor itself or a design flaw. Another possible cause was the spacecraft having lost guidance during the burn.
You can find a link to the full report in the show notes on DailySpace.org.
Statistics
And now, for some statistics.
The number of toilets in space is eight: four on the ISS, one on Soyuz MS-21, one on the Crew Dragon Freedom, one on Tianhe, and one on Shenzhou-14.
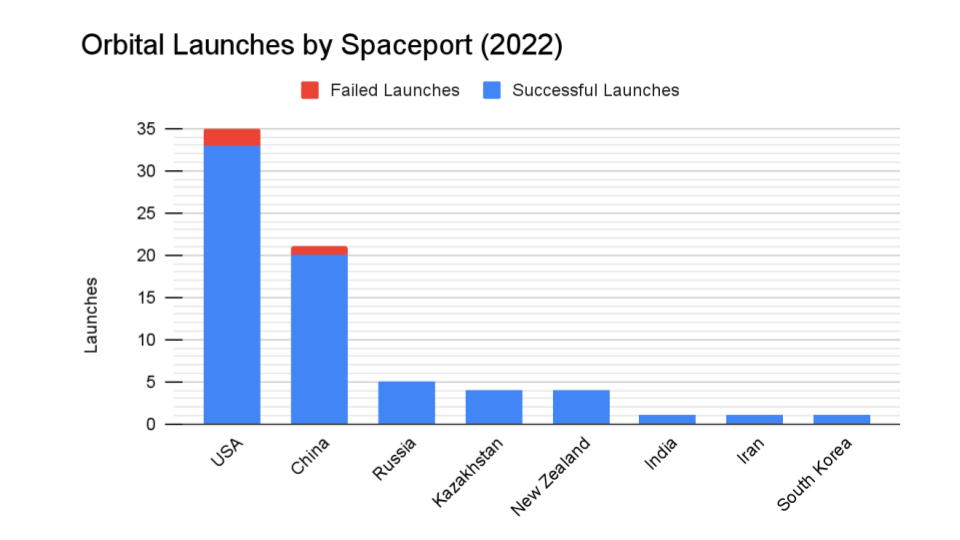
We keep track of orbital launches by launch site, also called spaceport. Here’s that breakdown:
USA 35
China 21
Russia 5
Kazakhstan 4
New Zealand 4
India 1
Iran 1
South Korea 1
From those 72 launches, a total of 1,116 spacecraft were put into orbit.
Your random space fact for this week is that scientists creating the Rectified Lunar Atlas in 1961 created their adjusted pictures of the Moon by projecting an existing picture of the Moon onto a globe and then taking photographs of that projection from different angles and distances to correct foreshortening.
This has been the Daily Space.
You can find more information on all our stories, including images, at DailySpace.org. As always, we’re here thanks to the donations of people like you. If you like our content, please consider joining our Patreon at Patreon.com/CosmoQuestX.
Credits
Written by Pamela Gay, Beth Johnson, Erik Madaus, and Gordon Dewis
Hosted by Pamela Gay, Beth Johnson, and Erik Madaus
Audio and Video Editing by Ally Pelphrey
Content Editing by Beth Johnson
Intro and Outro music by Kevin MacLeod, https://incompetech.com/music/
 We record most shows live, on Twitch. Follow us today to get alerts when we go live.