
Using the radiation signatures of quasars, scientists have determined when the era of reionization ended in our universe – about 1.1 billion years after the Big Bang. Plus, an update on NASA’s MAVEN spacecraft, new Hubble and Chandra images, and This Week in Rocket History is the TIROS-5 weather satellite.
Podcast

Show Notes
DAVINCI probe to plunge through Venusian atmosphere
- NASA press release
- “Revealing the Mysteries of Venus: The DAVINCI Mission,” James B. Garvin et al., 2022 May 24, The Planetary Science Journal
Another Mars spacecraft survives safe mode
- NASA press release
Hubble maps way for JWST
- MPIA press release
- “3D-DASH: The Widest Near-Infrared Hubble Space Telescope Survey,” Lamiya A. Mowla et al., to be published in The Astrophysical Journal (preprint on arxiv.org)
JWST: First science release July 12
- JWST press release
Clusters collide in shocking Chandra image
- CXO press release
- “The structure of cluster merger shocks: Turbulent width and the electron heating timescale,” H R Russell et al., 2022 May 17, Monthly Notices of the Royal Astronomical Society
The universe became transparent at age 1.1 billion years
- MPIA press release
- “Hydrogen reionization ends by z = 5.3: Lyman-α optical depth measured by the XQR-30 sample,” Sarah E I Bosman et al., 2022 June 7, Monthly Notices of the Royal Astronomical Society
New GOES-18 satellite maps lightning strikes
- NOAA press release
This Week in Rocket History: TIROS-5
- Dark clouds: The secret meteorological satellite program (part 1) (The Space Review)
- Dark clouds: The secret meteorological satellite program (part 2) (The Space Review)
- TIROS-5 mission page (NASA)
- TIROS mission page (NASA)
Transcript
Hey, Pamela. Survey science or observer-led science?
Huh?
Survey science or observer-led science? I heard that was a big debate in astronomy — should telescopes survey the sky or look at specific objects for observers?
Oh! Yes! That is a debate, but like a lot of debates, it turns out the answer is – both. We need both. And in this episode, we’ve got both!
So like the Hubble survey of galaxies and the Chandra observation of that one galaxy cluster? The stories you have in this episode?
Exactly! It is definitely both rather than either / or; the Universe likes to do improv.
And luckily engineers like to collaborate to push telescopes to observe all the challenging things the universe throws at us and to build the things we throw at the universe, which I’ll be talking about in This Week in Rocket History.
All of this now, right here on the Daily Space.
I am your host Dr. Pamela Gay.
And I am your host Erik Madaus.
And we’re here to put science in your brain.
I’m going to sneak in before the show really gets going to talk about a mission that hasn’t launched, yet. Sorry, Pamela.
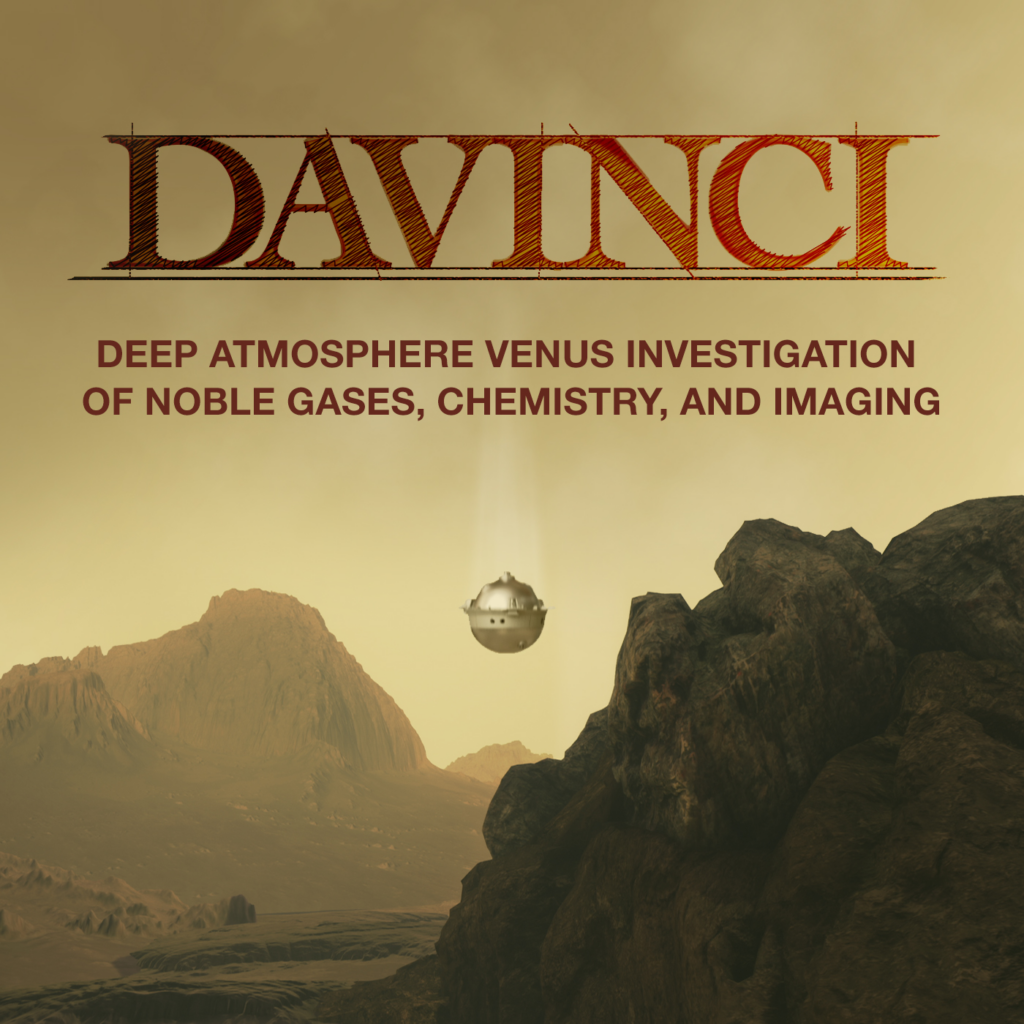
The Deep Atmosphere Venus Investigation of Noble gases, Chemistry, and Imaging (DAVINCI) mission is currently planned for a 2029 launch, and a recent paper published in The Planetary Science Journal has given us our first look at the mission’s plans.
In 2030, the spacecraft will do two flybys of Venus, during which instruments will study the clouds and map the highlands. And then at the end of 2031, the descent sphere will be dropped into the Venusian atmosphere. That probe carries five instruments that will measure everything they possibly can on the way down to… being crushed at the surface of Earth’s hellscape sister planet.
Lead author Jim Garvin explains: This ensemble of chemistry, environmental, and descent imaging data will paint a picture of the layered Venus atmosphere and how it interacts with the surface in the mountains of Alpha Regio, which is twice the size of Texas. These measurements will allow us to evaluate historical aspects of the atmosphere as well as detect special rock types at the surface such as granites while also looking for tell-tale landscape features that could tell us about erosion or other formational processes.
The probe is going to take only one hour to reach the surface of Venus, and the plan is to collect all the necessary scientific data during the descent. If the probe manages to survive impacting the surface at twelve meters per second, and that’s a big if, operations could continue for another fifteen minutes or so – under ideal conditions, that is. Personally, I expect conditions at the surface of Venus to be less than ideal. Nonetheless, this mission is pretty exciting in a lot of ways, and I’m looking forward to the science that comes out of all that data.
Now let’s turn to an already operational mission at Mars.
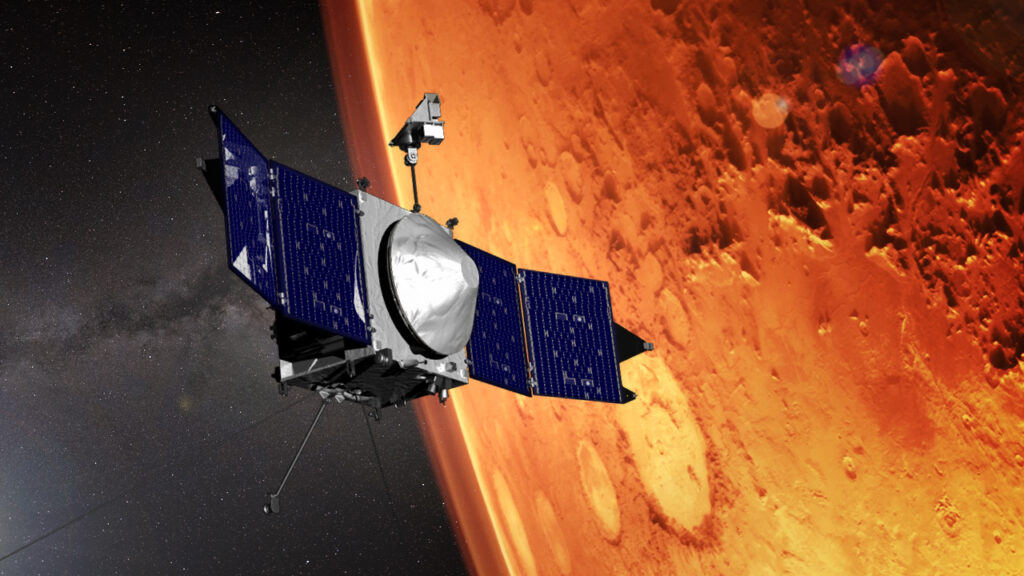
NASA’s MAVEN spacecraft has been orbiting Mars since 2016. Parts of the spacecraft are beginning to show their age, and it has had its share of problems, most recently from February to May of this year. On February 22, 2022, MAVEN entered safe mode, a mode where it doesn’t do any science or other activities to protect itself.
The root cause of the most recent issue was a problem with the spacecraft’s Inertial Measurement Units (IMU). These tell the spacecraft what direction it is pointing in space. The issue began when the spacecraft computer could not get any data from either IMU. Following its programming, MAVEN first rebooted the main computer; just like a home machine, the first step was to turn it on and off again. The reboot didn’t work, though, so the spacecraft switched to its backup flight computer. Using the backup computer, the team was finally able to get data from the IMU but only from one of them and only for 78 minutes.
So the team ended up on IMU-2, a unit they’ve had problems with before and could not rely on for the next years of spacecraft life. This meant that a new method was needed, and it was one flight controllers were planning to implement eventually: all stellar navigation.
MAVEN has star trackers which helped it navigate from Earth to Mars; these tell the spacecraft what it’s pointed at by what stars are where. The original plan was to switch to all stellar navigation in October of this year, and the team worked really hard to develop the software faster, sending the new code to the spacecraft in April. After a month of testing, MAVEN was put in all stellar navigation mode full time on May 28.
With this new mode – and some occasional use of the IMUs as needed – the spacecraft can continue science and other duties through its next extended mission.
Telescopes and other instruments generally do science in one of two modes. They may make highly targeted images to try and answer one specific question. For instance, does that nebula contain a pulsar? They can also do surveys that look at either large numbers of the same kinds of object or large areas of the sky to explore what is out there if you have a statistically significant sample. MAVEN is out there sampling Mars’s atmosphere, surveying how we can see it change if we have enough data.
And Hubble is out there surveying galaxies in vast numbers, looking for star formation.
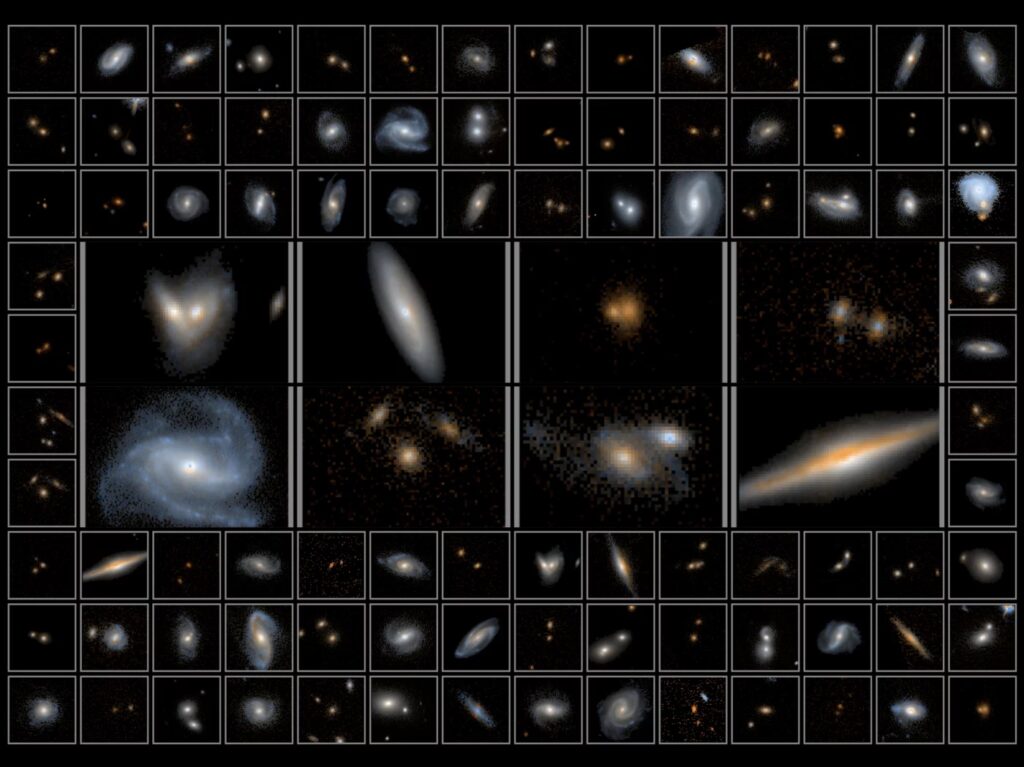
In a new survey named 3D-DASH for 3d-Drift and Shift, the Hubble Space Telescope explored a region several full moons in size looking for ancient galaxies rich in star formation. This survey used Hubble’s infrared capabilities to reveal details hidden by dust in the earlier COSMOS survey, which looked at the sky in wavelengths closer to what our eyes can see. Between COSMOS and 3D-DASH, Hubble surveys are allowing researchers to explore in detail how age, structure, environment, and other factors come together to shape the universe.
This survey is released in The Astrophysical Journal and led by Lamiya Mowla, who explains: I am curious about giant galaxies, which are the most massive ones in the Universe formed by the mergers of other galaxies. How did their structures grow, and what drove the changes in their form? It was difficult to study these extremely rare events using existing images, which is what motivated the design of this large survey.
If you find yourself thinking, “Why is Hubble doing infrared surveys when JWST is about to start science?” Well, that’s a fair question. JWST hadn’t actually launched when this research was started, and Hubble sees the sky in different colors than JWST, with Hubble seeing shorter wavelengths of infrared – ones closer to what our eyes can see – than what JWST will be able to see. It is hoped that the work that Hubble has done in this region, with both the COSMOS and 3D-DASH surveys, is just the appetizer for what JWST will be able to do if it works as planned.
And on July 12, we should see just what JWST is capable of. NASA has announced that the first images will be released as part of a live broadcast from NASA’s Goddard Space Flight Center. We will cover this event live on Twitch.tv/CosmoQuestX.
From survey instruments we now turn to individual object results, coming to us from the Chandra X-Ray Observatory.
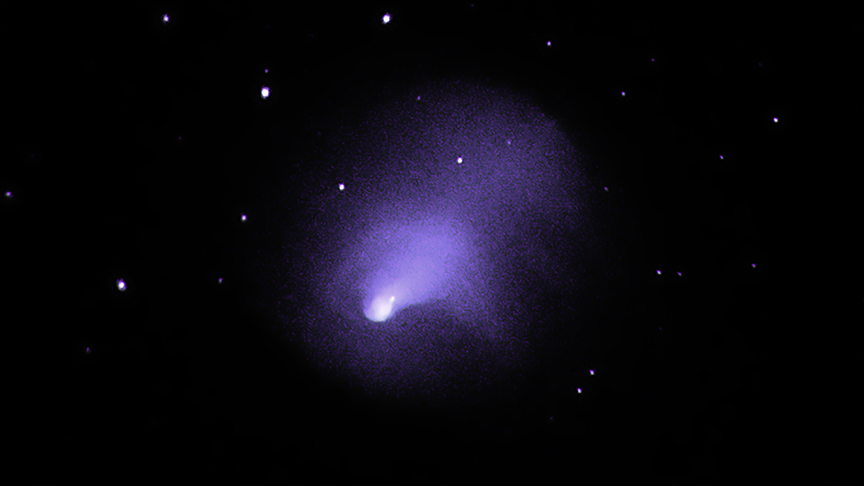
When surveys turn up super cool objects, those objects often get special, prolonged attention from telescopes of all kinds. In one stunning case, the merging galaxy cluster Abell 2146 was initially cataloged in the middle of the last century using optical images and is now studied in detail by the Chandra X-ray Observatory. This system is actually two massive collections of galaxies that are colliding together and, in the process, are creating massive shockwaves as their gas, dust, and even dark matter intermixes.
In images released with a new paper in Monthly Notices of the Royal Astronomical Society and led by Helen Russell, the core of one of these two clusters shines bright and is trailed by material. We are seeing the collision push the hot gas out behind the cluster. In software, researchers enhanced the details to reveal shock waves curving out in front and behind this core, marking how both systems have reshaped the gas as they passed through one another.
This is exactly what should happen, and the details of how it happens reveal the galaxy cluster’s densities, temperatures, and even the timescales for the interactions.
This is science made beautiful not by the picture; it is basically a purple blob. No, this is science made beautiful by our understanding.
A lot of astronomy just isn’t as stunning visually as it is conceptually. Thank God for artists; they are able to take these concepts and make them into illustrations that are so much more pleasing than what our telescopes show us.
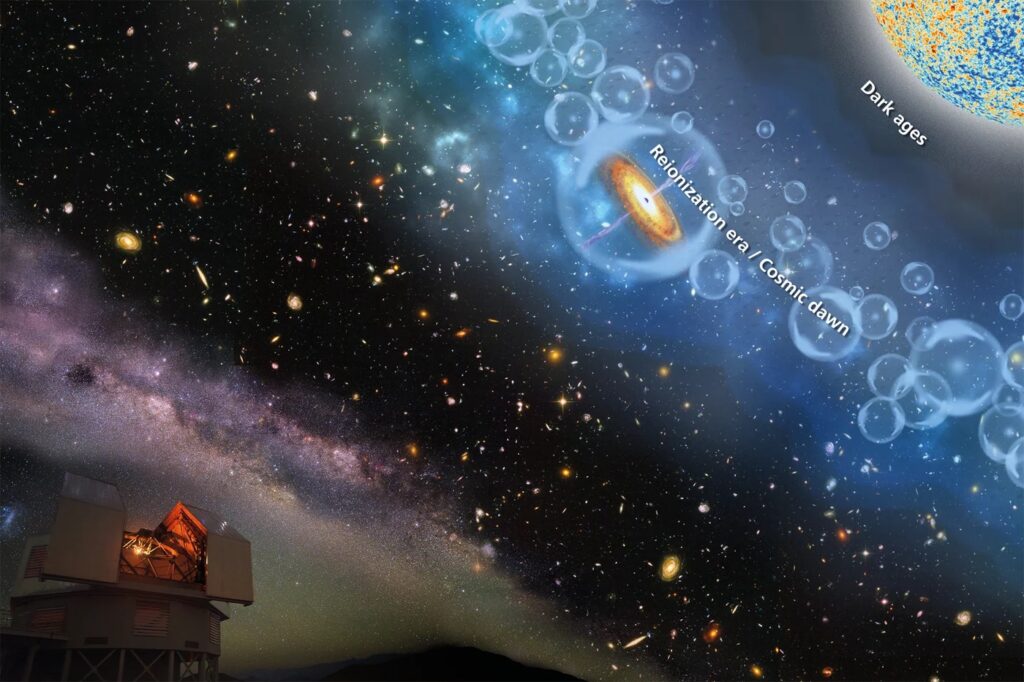
Case in point: New research led by Sarah Bosman and published in Monthly Notices of the Royal Astronomical Society determines that our universe finished ionizing the bulk of the hydrogen between galaxies by the time it was 1.1 billion years old. In doing this study, this team looked at the light from 67 quasars – extremely bright and distant galaxies – and looked to see if their light was absorbed by neutral hydrogen gas on its way to our telescope. Cold, neutral hydrogen gas will absorb light in specific colors, and when we see these absorptions, they tell us not only that the gas is present but also when it was present. Ionized hydrogen gas – well, light goes right through it.
After about 1.1. billion years, the universe seems to have stopped having large regions of neutral gas that absorbed light. We know the process of our universe going from a vast cloud of neutral gas to being full of stars and galaxies that ionize the gas was a long process. In follow-up research, Bosman and her team plan to map out how the gas was ionized, and look for the details of how the first stars transformed our gassy universe.
All this research is made possible using telescopes on and above our Earth. New telescopes are constantly being built, and while JWST is the most famous new facility, it is not the only new facility.
There has been a lot of news about clouds in our show today, from those in Venus’s atmosphere to gaseous ones out in the wider universe. And this next story comes back home to clouds on Earth.
Back at the beginning of March, NOAA launched the GOES-T spacecraft aboard a ULA Atlas V. While the satellite is still in the post-launch testing and calibration phase, the agency has already renamed it GOES-18. NOAA plans to replace GOES-17, which is currently being used as GOES-West, with GOES-18 early in 2023. Despite still being considered ‘non-operational’, GOES-18 is already providing data on lightning strike observations here in the Western Hemisphere.
Last month, the Geostationary Lightning Mapper (GLM) instrument onboard captured the massive amount of activity that occurred when a derecho moved through the Northern Plains of South Dakota into Minnesota and across parts of Ontario. Derechos not only bring rain and lightning but strong winds and even tornadoes and dust devils. Our own Canadian community members in Ottawa were affected by the wall of storms that downed trees and took out power – including outages that lasted for 10 plus days.
Having the lightning mapper onboard GOES-18 means that meteorologists can better determine how electrically active a storm system is and how much of a threat the lightning presents. The information collected also helps see where storms are weakening, surging, and just generally evolving. And all of this data can supplement areas where radar coverage is thin on the ground.
GOES-18 can even fly along with a storm, tracking individual storm cells. Our weather satellites have come a long way.
Coming up next, Erik is going to look back at one of the first weather satellite programs in the U.S.
This Week in Rocket History
Thought we were done talking about clouds from space? Nope!
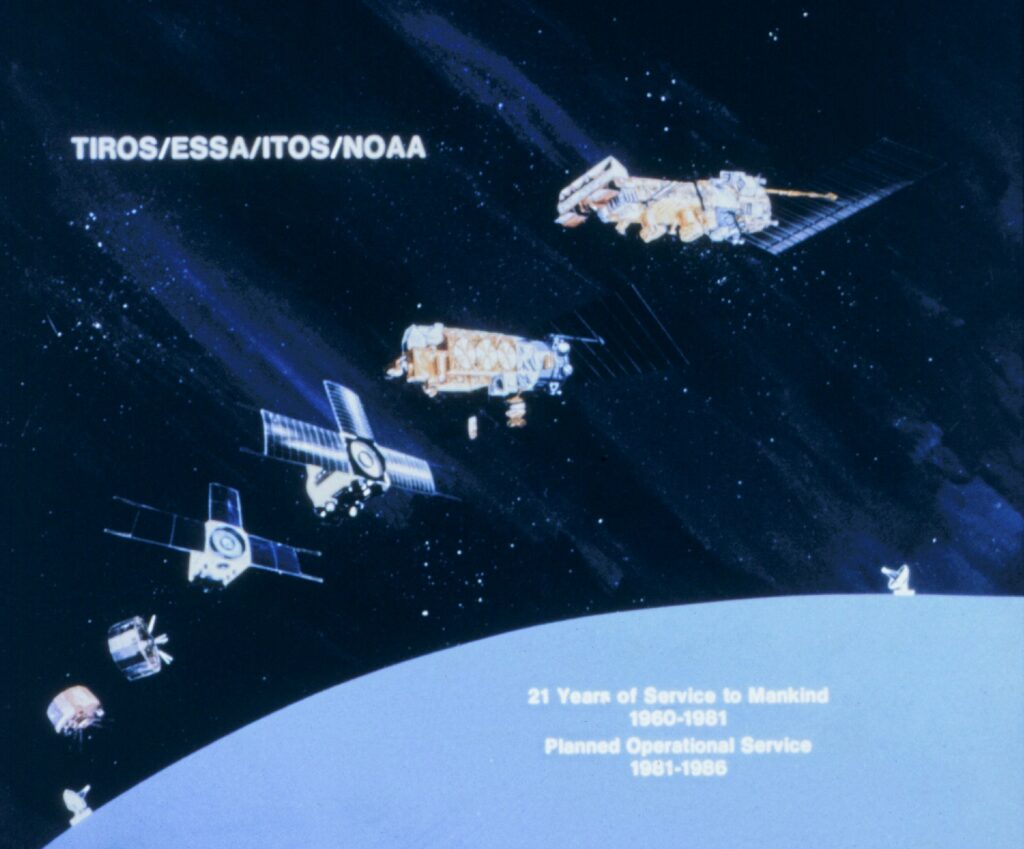
Since the beginning of the space age, people have thought of work for satellites to do that other systems could not. One of these tasks was weather forecasting, particularly predicting cloud cover for military purposes. The Television Infrared Observation Satellite Program, or TIROS program, was initially a classified military reconnaissance program under the United States Air Force, but it was transferred to NASA in mid-1959 because weather observation was considered appropriate for a civilian agency and not the military. Also, the military didn’t want a weather satellite but don’t worry, they would get one later.
The TIROS program includes the original TIROS-1 through 10; the TIROS Operational System, which had nine satellites designated ESSA-1 through ESSA-9; the Improved TIROS, which had nine satellites with various designations, including NOAA-1; TIROS-N with five satellites; and Advanced TIROS-N, which started with NOAA-8 in 1983 and continues to this day. The most recent satellite in this group is NOAA-19, which was launched in 2009 and is still operational. In fact, we’re going to tell you about NOAA-19 in an upcoming episode of Daily Space.
The first Television Infrared Observation Satellite, TIROS-1, was launched a year after NASA took over in April 1960. It was a simple cylindrical satellite with two cameras on the bottom, one fixed antenna on the top to send and receive science data, and two fixed antennas on the bottom to downlink telemetry. Like other satellites of the time, TIROS-1 was solar-powered. It worked – mostly – and proved that satellites could be used for Earth observation.
The cameras on TIROS-1 produced black and white images – sufficient for the primary mission of photographing clouds – using television video tubes. These tubes worked sort of like modern digital camera sensors, interpreting brightness by the intensity of an electrical signal and then building up an image by scanning lines left to right, bottom to top. The cameras had a ground resolution of 30 meters per pixel with a swath width of 300 kilometers. This resolution was useful for determining large storm patterns from cloud cover but could also capture phenomena as small as individual tornadoes.
TIROS-1 also introduced different satellite orientation sensors – Sun and horizon sensors – updated versions of which are now widely used on virtually all satellites.
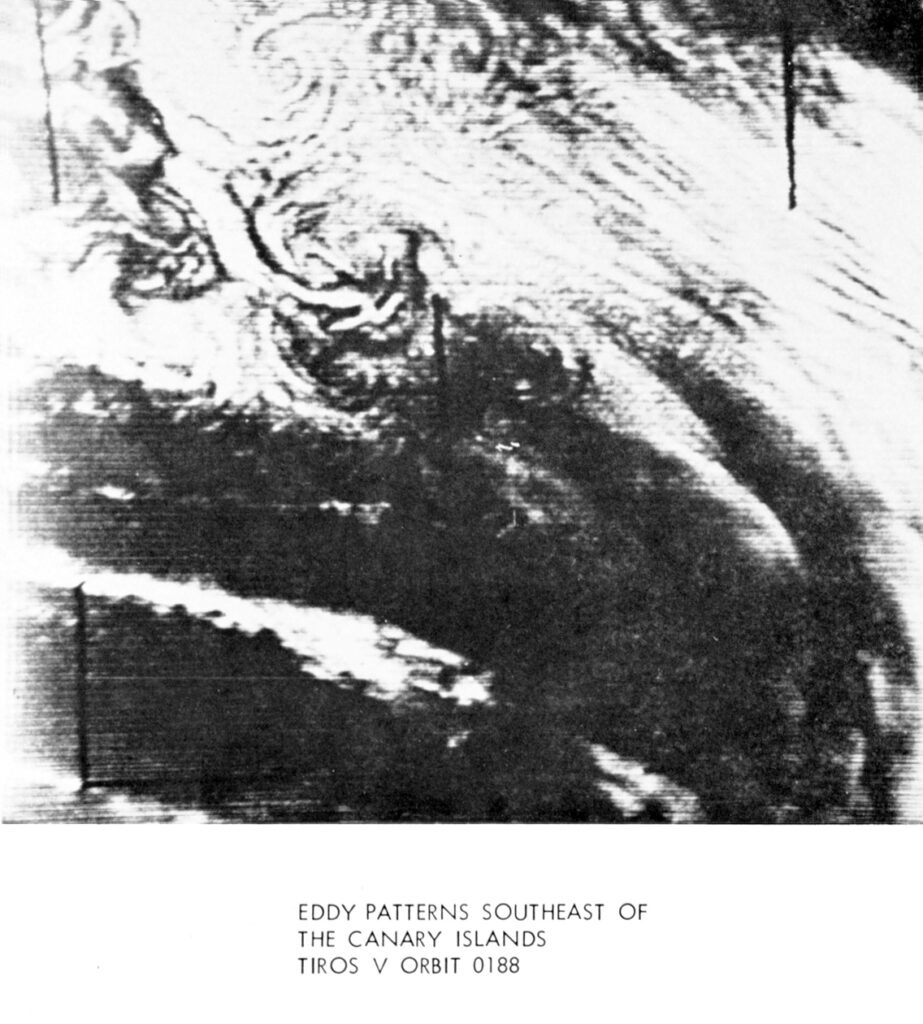
TIROS-5, part of the original series of ten satellites, was launched on June 19, 1962, on a Thor-Delta rocket. This satellite was launched into a higher inclination orbit than the four predecessors, allowing TIROS-5 to see more of the Earth. The satellite was a roughly one-meter diameter, spin-stabilized cylinder, allowing the cameras to sweep around and cover a much larger area in each orbit than if it was pointed straight down, effectively getting 65 degrees of inclination coverage from its 58-degree inclination orbit.
This spin was controlled by small solid motors that used a primitive but effective magnetic torque to control attitude relative to the ground, allowing ground controllers to identify where images were taken within two degrees of accuracy. Previous TIROS satellites had wobbled due to the Earth’s magnetic field, meaning scientists couldn’t tell precisely where the cameras were pointed. That’s not very useful for a weather satellite.
TIROS-5’s medium-angle camera failed seventeen days after launch, but the spacecraft itself remained functioning until May 14, 1963, when the wide-angle camera failed. Most of the camera was still working, but the electronics for the critical shutter mechanism had failed. After this failure, TIROS-5 was turned off and left to decay from orbit.
Fortunately, TIROS-6 was launched in September 1962, before TIROS-5 completely failed, and was launched into a similar orbit.
As of early-June 2022, eight of the first ten TIROS satellites, including TIROS-5, are still in orbit.
Statistics
And now, for some statistics.
The number of toilets in space is eight: four on the ISS, one on Soyuz MS-21, one on the Crew Dragon Freedom, one on Tianhe, and one on Shenzhou 14.
We keep track of orbital launches by launch site, also called spaceport. Here’s that breakdown:
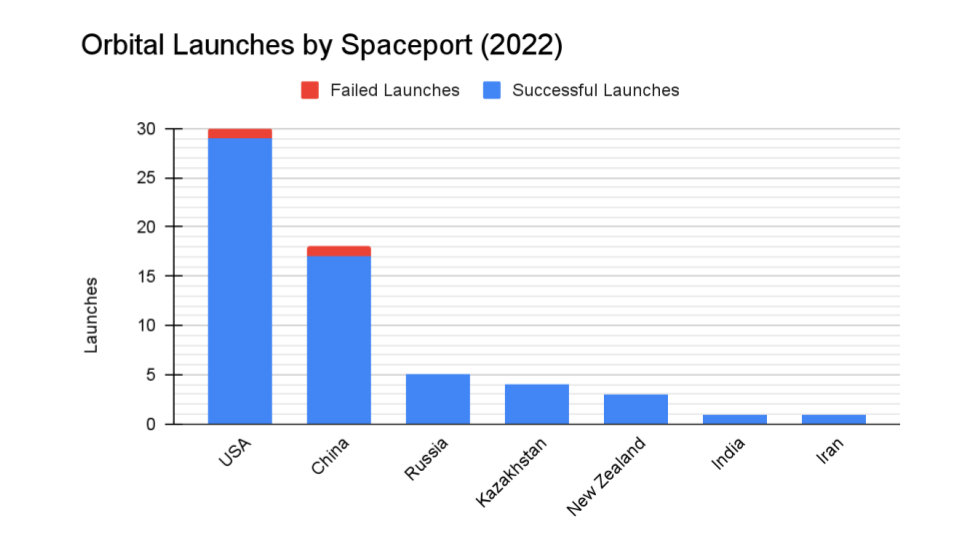
USA 30
China 18
Russia 5
Kazakhstan 4
New Zealand 3
India 1
Iran 1
From those 62 launches, a total of 1,041 spacecraft were put into orbit.
Your random space fact for this week is that NASA’s crawlerway at Kennedy Space Center is paved with river rocks rather than asphalt. These rounded, mostly quartz rocks act like ball bearings under the crawler vehicle, allowing for easier turns and reducing vibrations. Because the rocks are gradually crushed over time and need to be replaced, NASA has bought rocks from Tennessee, Georgia, and most recently, Alabama. Currently, the crawlerway contains an estimated 70,000 tons of river rock.
This has been the Daily Space.
You can find more information on all our stories, including images, at DailySpace.org. As always, we’re here thanks to the donations of people like you. If you like our content, please consider joining our Patreon at Patreon.com/CosmoQuestX.
Credits
Written by Pamela Gay, Beth Johnson, Erik Madaus, and Gordon Dewis
Hosted by Pamela Gay, Beth Johnson, and Erik Madaus
Audio and Video Editing by Ally Pelphrey
Content Editing by Beth Johnson
Intro and Outro music by Kevin MacLeod, https://incompetech.com/music/
 We record most shows live, on Twitch. Follow us today to get alerts when we go live.