
A new theory has been proposed that could answer the question of what causes recurring landslides on Mars: small-scale ice melting just below the surface may leave the regolith vulnerable to wind. Plus, a look at some of Earth’s ancient climate changes, a gamma-ray source, puffy galaxies, and this week’s What’s Up.
Media

Transcript
Hello and welcome to the Daily Space. I am your host Dr. Pamela Gay.
And I am your host Beth Johnson.
And we are here to put science in your brain.
In the big news of the day, a team led by SETI Institute scientist Janice Bishop has advanced a theory for why the recurring landslides on the surface of Mars happen. The new paper, published in Science Advances, is kind of a big deal among Mars scientists because this phenomenon, called Recurring Slope Lineae, has been a mystery for years.

Recurring Slope Lineae, or RSL, are seasonal landslides that appear to be some kind of flow feature, and previous theories thought they could be liquid debris flows or even dry landslides. But neither theory really explained how these RSLs work. Imaging data taken from the HiRise camera on the Mars Reconnaissance Orbiter has shown the expansion of RSLs over time, and studies have focused on Mars analog sites here on Earth. Space is hard, and we haven’t managed to send people to Mars, yet, obviously, to do the science in situ, so Earth is the next best thing.
The locations studied on Earth include dry valleys in Antarctica, the Dead Sea, and the Salar de Pajonales in Chile’s Atacama Desert. These locations have a similar combination of salts and water to what we have measured on Mars and make for good places to sample and observe the interactions between those components. What this research team found was that when salts interact with water underground, the surface above becomes unstable and prone to collapse.
In fact, in Chile, there are gypsum beds with huge voids underneath where the ground has been swept away.
Now let’s go into the lab. Per the press release: To test their theory, the team conducted lab experiments to observe what would occur if they froze and thawed Mars analog samples comprised of chlorine salts and sulfates at low temperatures such as would be found on Mars. The result was slushy ice formation near -50 °C, followed by gradual melting of the ice from -40 to -20°C.
This slush is thought to migrate underground on Mars, moving the water along between the various salts and sulfates. Bishop noted: I was thrilled to observe such rapid reactions of water with sulfate and chlorine salts in our lab experiments and the resulting collapse and upheave of Mars analog soil on a small scale, replicating geologic collapse and upheave features in karst systems, salt reservoirs, and edifice collapse on a large scale.
Here is the TL;DR version: We know there is water under the surface of Mars. We’ve talked about several recent discoveries locating subsurface reservoirs in the past few months even. And now it seems this subsurface water is responsible for mixing with salts in the soil and causing slope instability during warmer months. Bring in even that light Martian wind or dust storms, and you have enough force to cause the surface soils to slide.
Pretty neat stuff.
In a new study in the Proceedings of the National Academy of Sciences, researchers used carbonate muds to piece together a more complete timeline of climate changes during the Earth’s Paleozoic era, about 500 million years ago. This era was when animals began to dominate over microbes.

The technical side of this analysis gets into chemistry (sorry, Pamela), so let’s start with a few basics before we dig into the science.
One of the ways in which we measure the age of stuff is called radiometric dating. Most of you have heard of this method in the context of carbon-14, which is an isotope of carbon and used to measure the ages of organic matter. Carbon-14 decays into nitrogen-14, and we can measure the ratio of the two isotopes in a bit of organic matter like wood or bone. We know what the starting isotope ratio should be, and we know the half-life of the carbon-14, so we can figure out the object’s age. But for carbon-14, the half-life is only about 6000 years, much too young for paleontology.
So how did we find out how old all those ancient fossils were? We used different isotope pairs that have longer half-lives, like uranium and lead. And then we used those ages to create a timeline of what creatures lived when and found we can even go further into chemical analysis to learn about the climate at various times.
Enter two other isotopes: oxygen-18 and oxygen-16. Oxygen-18 is the heavier of the two, and it will be the more dominant of the two isotopes at lower temperatures. Co-author Kristin Bergmann explains: As an example, if carbonate precipitates at 4 degrees Celsius, more oxygen-18 ends up in the mineral, from the same starting composition of water, [compared to] carbonate precipitating at 30 degrees Celsius. So, the ratio of oxygen-18 to -16 increases as temperature cools.
Of course, using the oxygen ratio depends on having carbonate shells, and scientists wanted to find another method. In this case, they used “clumped isotope geochemistry”, pairing two isotopes — oxygen-18 and carbon-13. This pairing is dependent on temperature but isn’t affected by alterations due to other ocean chemistry, which is excellent news.
Now here is the easy part, so if you tuned out on the chemistry, come on back. The team used samples of carbonate muds taken in Norway and western Newfoundland, where exposed rocks date back to this early Paleozoic era. Since these rocks had experienced little chemical change since formation, they could be used to test this new method. The temperatures calculated based on the new oxygen-carbon clumps matched the lower-resolution oxygen ratio results, proving the method a success and showing that temperature had an effect on the diversity of life.
This new timeline is more detailed than previous versions because by analyzing a combination of isotopes in these carbonate muds, scientists were able to base their calculations on incredibly common carbonate-rich sediments rather than relatively scarce carbonate shells. It’s an important step to creating an even more complete timeline going back further in the history of our planet since we don’t have fossils to date before about a billion years ago. That leaves us with four billion years of unknown climate data and a handful of potential hypotheses.
Speaking of climate data and historical timelines, a recent paper in Geophysical Research Letters looked at paleohurricane records in the Bahamas. These records were in the form of sedimentary cores taken from South Andros Island. Scientists wanted to examine the likelihood that climate change in the past was responsible for an increase in the number of hurricanes. Many scientists today argue that the current climate change situation has increased and will continue to increase the overall intensity of hurricanes, but the question remains if the number of hurricanes will also increase.

The team created a model that mimicked the hurricane data found in the sandy layers of the Bahamas, and they used that model to generate 1,000 different pseudorecords using the same climate simulation. Each of these pseudorecords contained a similar mix of quiet and active periods to the original cores. And the team found that the outcomes were random; the intervals of active and quiet did not sync up with the changes in climate.
It should be noted that this doesn’t mean hurricanes occur randomly. It means that this one location’s hurricane history cannot be explained by long-term changes in the climate. The team hopes to conduct broader, more global studies of paleohurricane data in the future. It would be nice to have a better idea of how bad our hurricane seasons might get.
There are some science stories that are pleasing because the universe is doing something that just makes sense. Our next story is one of those stories. In a new paper in The Astrophysical Journal, researchers led by Anshu Gupta and Kim-Vy Tran document how tightly formed massive galaxies blow out their own star formation in ways that more puffy galaxies do not.
Puffy is actually the word scientists use to explain this work, although in the science paper they instead referred to these galaxies as more extended. We’re going to go with puffy.
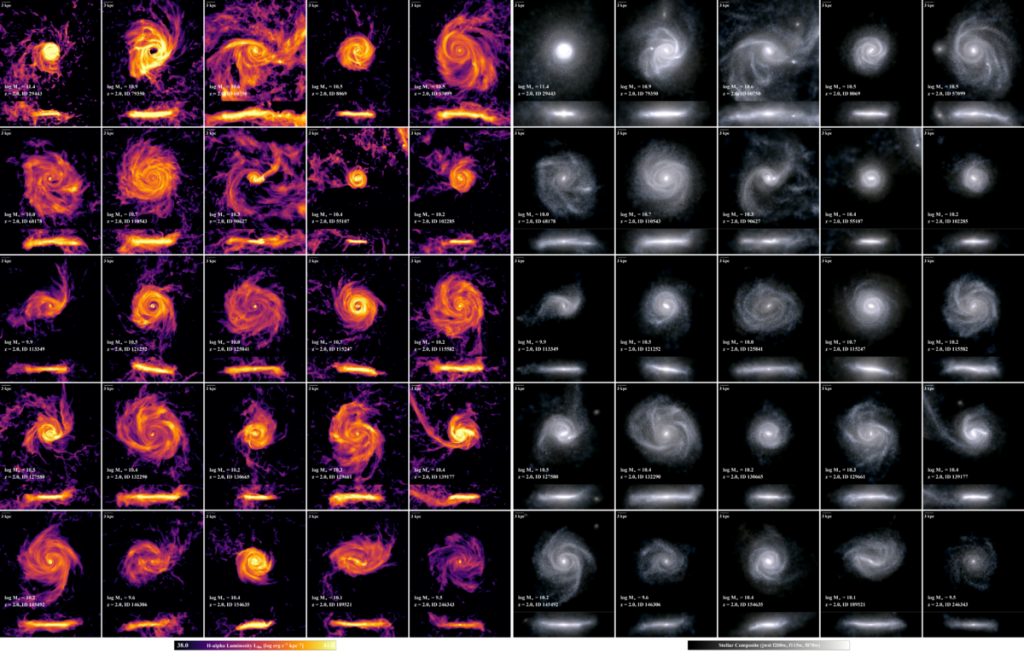
Here’s what’s happening. Early in the universe, a large population of galaxies grew up together, reaching large sizes and maximum star formation about four billion years after the universe formed. While many galaxies, including our own, continued to form later, we weren’t among the cool kids who did everything as a pack early in the universe.
Some of those early galaxies packed their material tightly near their core. In these systems, the combination of massive star formation, periodic supernovae, and all the crazy things that go on when stars are young, those activities send material into the galaxies’ supermassive black holes. As material falls toward a black hole, it forms a bright accretion disk, and the light from that bright disk can actually exert enough force on surrounding material that it can push that material out of the system.
With that material gone, star formation comes to a halt as the galaxy quiets down.
In more extended or puffy systems, the star formation is spread out, and what is going on in one place is less likely to affect what is going on in another place. This paper documents how puffy galaxies essentially protect their star formation. Material isn’t pushed toward the black hole. It isn’t flung out of the system. Everything just putters along. This is essentially the galaxy example of how a small fire in a dense forest can burn down everything, while that same fire in a parking lot with a few trees here and there for shade might catch one or two trees on fire, but generally won’t burn down everything.
Bottom line, puffy galaxies are the place to be if you want long periods of star formation over billions and billions of years. Those tightly packed systems? They’re where you’ll see all the active galaxy fireworks before everything grinds to a halt, early in the Universe.
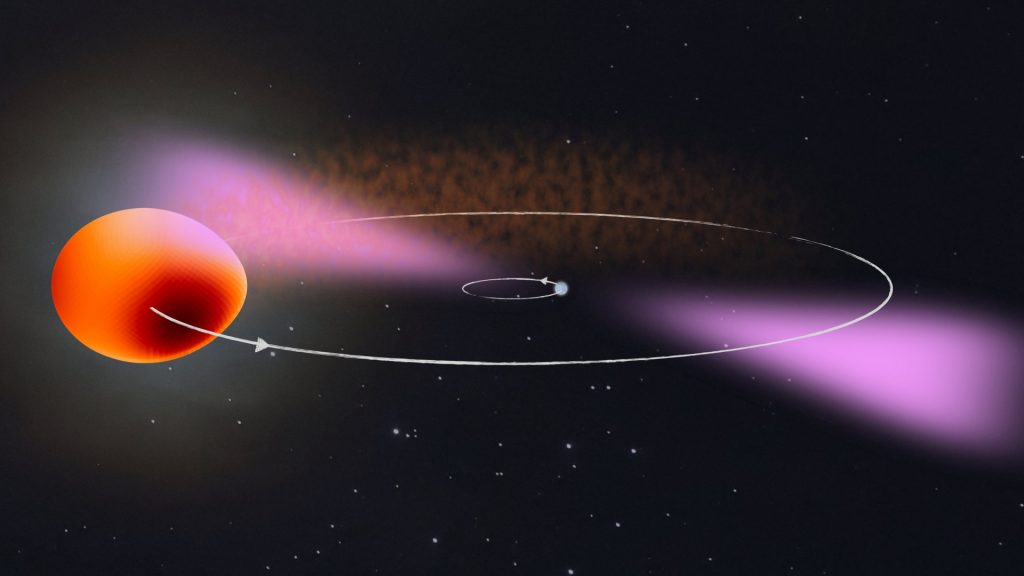
Exactly how you put things together really matters. It turns out that dense neutron stars next to tiny dwarf stars can lead to the neutron star just plain destroying the tiny star. These systems are called spider pulsars, and individual systems are given names like “black widows”, “redbacks” and so on after spider species where the female devours her mate.
Finding these systems is a challenge. They generally make themselves known through periodic gamma-ray flickering, but flickering alone could be many different things. The latest to be identified required the use of many telescopes and the computing power of thousands of volunteers.
The Fermi space telescope had previously spotted a source, inelegantly named 3FGL J2039-5617, that had associated optical and X-ray variations that seemed to indicate that there was a binary star system at the center of all these strange signals. The orbital period appeared to be about 5.5 hours. Remarkably, the changes in optical light the team observed showed changing colors and brightnesses that seemed to indicate that a tiny star about one-sixth the size of the Sun was being distorted into something like a teardrop shape and heated up on the distorted side.
That something was too tiny to be accurately identified using optical telescopes.
And the Fermi Telescope data, which was perfect to solve this mystery, was too big for any one telescope to sort through in less than 500 years. And let’s face it, no one has time for that.
This is where citizen science comes in. The Einstein@home project acts as a screen saver, and while you aren’t using your computer, it will use your computer to process data for research teams like this one. That 500-year processing time got reduced to just two months thanks to the myriad volunteers who donated their processors to this task. In the data, they found gamma-ray flickering consistent with that tiny but massive unseen companion being a neutron star that rotates 377 times per second. It is so energetic that it is evaporating away that one-sixth solar mass companion the researchers can see.
This work is described in a new paper in the Monthly Notices of the Royal Astronomical Society, and according to lead author Colin Clark: For J2039-5617, there are two main processes at work. The pulsar heats up one side of the light-weight companion, which appears brighter and more bluish. Additionally, the companion is distorted by the pulsar’s gravitational pull causing the apparent size of the star to vary over the orbit.
To add some context, that one-sixth solar mass star is several times bigger than Jupiter in size but packs more mass than the Sun has into a volume you could roughly rest on Manhattan if you felt like destroying the planet because that is exactly what this star would do. This neutron star is smaller than your average moon and smaller than a big asteroid, and it is a destroyer of stars.
This is your friendly reminder, the universe is trying to kill us.
What’s Up

Each week, we’ve been bringing you different things that you can go outside and look up to see. This week, since we’ve been talking about eclipsing binaries on a regular basis, it seems like a good time to point out an eclipsing binary. And there just happens to be one easy to see that on Saturday night, about 12:46 am, as Saturday passes into Sunday for those of you on the east coast of the United States, or at 9:46 for those of you in the Pacific time zone.
At that time, the star Algol will reach its faintest magnitude. We have finding charts up on our website that will allow you to locate this star. It’s actually in a really cool ‘V’ of bright things you can look at, ranging from Betelgeuse arching through Aldeberaan down to the planet Mars.
As you spike back up through the other arm of the V, it carries you through the constellation Perseus. And if you go out right after sunset on Saturday, you’ll see Algol about its regular brightness, a little bit fainter than the star above it if you look north, and as the night goes on, its brightness is going to fade away until it’s significantly fainter than many of the other stars that are in Perseus around it.
If you want help finding this and if you want comparison stars to compare the brightness, we’ve got it all on our website, DailySpace.org. This is your chance to see an eclipsing binary eclipse.
If you are interested in observing more variable stars like this one — both systems you can see with your unaided eye or observer with binoculars and telescopes — you should check out the American Association of Variable Star Observers. This Massachusetts-based nonprofit brings together data on variable stars collected by volunteers of every type and makes them available to researchers for free. The organization played a major role in last year’s dimming of Betelguese, which is a story we’ll be updating you on tomorrow.
This has been the Daily Space.
Learn More
Mystery of Mars’ Recurring Slope Lineae Possibly Solved
- SETI Institute press release
- “Martian subsurface cryosalt expansion and collapse as trigger for landslides,” J.L. Bishop et al., 2021 February 3, Science Advances
New Climate Change Timeline Extends Back to Paleozoic
- MIT press release
- “A high-resolution record of early Paleozoic climate,” Samuel L. Goldberg et al., 2021 February 9, PNAS
Paleohurricane Research Examines Effects of Climate on Activity
- Eos article
- “Centennial‐Scale Shifts in Storm Frequency Captured in Paleohurricane Records From The Bahamas Arise Predominantly From Random Variability,” Elizabeth J. Wallace et al., 2020 December 6, Geophysical Research Letters
Source of Gamma-ray Flicker Found Using Einstein@home Project
- The University of Manchester press release
- “Einstein@Home discovery of the gamma-ray millisecond pulsar PSR J2039–5617 confirms its predicted redback nature,” C J Clark et al., 2020 November 23, Monthly Notices of the Royal Astronomical Society
Puffy Galaxies Keep Up Star Formation Longer Than Tightly Packed Galaxies
- Astro3D press release
- “MOSEL and IllustrisTNG: Massive Extended Galaxies at z = 2 Quench Later Than Normal-size Galaxies,” Anshu Gupta et al., 2021 February 2, The Astrophysical Journal
What’s Up: Algol Minimum and AAVSO
- Sky & Telescope article
- Beta Persei (Algol, the “Demon Star”) (Skyscrapers, Inc.)
- Algol finder chart (University of Hawai’i)
- AAVSO website
Credits
Written by Pamela Gay and Beth Johnson
Hosted by Pamela Gay and Beth Johnson
Audio and Video Editing by Ally Pelphrey
Content Editing by Beth Johnson
Intro and Outro music by Kevin MacLeod, https://incompetech.com/music/
 We record most shows live, on Twitch. Follow us today to get alerts when we go live.