Media
Transcript
It’s 2020, and let’s face it, all of us are occasionally feeling a little lost. Is it Tuesday? Wednesday? Who knows. Let’s call it Blursday. Where is everyone? In a Zoom window that could be connected to Kansas or Canada. It’s all become a foggy question mark.
The thing is, what you’re feeling is the reality of our astronomical understanding. Where are we? When are we? It’s all a bit of blur in this universe that is somewhere between 13.5 and 14 billion years old and from our perspective inside our galaxy of ill-described size from our imperfectly known position.
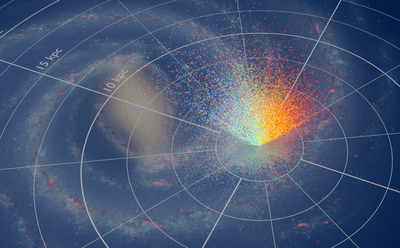
Astronomers are constantly working to figure out our place in space, and a new dataset helps get us a little closer to understanding how we fit in with the flow of stars in our galaxy. A new data release from the RAdial Velocity Experiment (RAVE) contains fifteen years of data tracing the motions and chemistry of 451,783 stars. This single project took advantage of almost every clear night in Siding Spring, Australia from 2003 to 2013 to obtain spectra using the 1.2m UK Schmidt telescope with a multi-fiber spectrograph that could observe up to 150 stars at a time. The data has been released in batches over time.

Yesterday, the RAVE collaboration put out their final data release. This is as good as it gets, and this data is now available to any researcher seeking to understand the structure and history of our galaxy. This data is described in a pair of papers in the Astronomical Journal with lead author Matthew Steinmetz.
Spectra take the light of stars and spread it out into a rainbow of color with dark and light bands that denote where specific atoms are absorbing and emitting light. The red and blue shifts in this light tell us how these stars’ distances from us are changing, either toward or away from us. They also tell us the stars’ compositions, allowing astronomers to look for ancient stars with fewer elements, and to trace out the bands of stars that once formed together from the same molecular clouds.
According to the press release: Some of the key results of RAVE include the determination of the minimum speed needed for a star to escape the gravitational pull of the Milky Way. The results confirmed that dark matter, an invisible component of the Universe of yet unknown nature, dominates the mass of our Galaxy. With RAVE it could be shown that the Milky Way disk is asymmetric and wobbles owing to the interaction with spiral arms and the infall of satellite galaxies. RAVE also allowed for the identification of stellar streams in the solar environment. These streams of stars are the residues of torn apart old dwarf galaxies that have merged into our Milky Way in the past.
This is an amazing data set. Earlier data releases have already led to more than a thousand research papers, and we look forward to seeing what new insights this latest release will bring.
Astronomy is a science that tries to tackle fundamental questions. Where are we? Where did we come from? How will it all end? These are questions that are relevant at every scale, and we don’t always have answers. I can’t tell you where the universe came from, only that it’s here now. I can, however, tell you a story that describes how we think our small solar system came to be, and this story is based on what we’ve learned from looking at other solar systems forming among the stars.
Right now our understanding of solar system formation is more of an illustrated picture book than a complete documentary movie. We have snapshots of understanding, but the details are sketchy. We are filling in details over time.
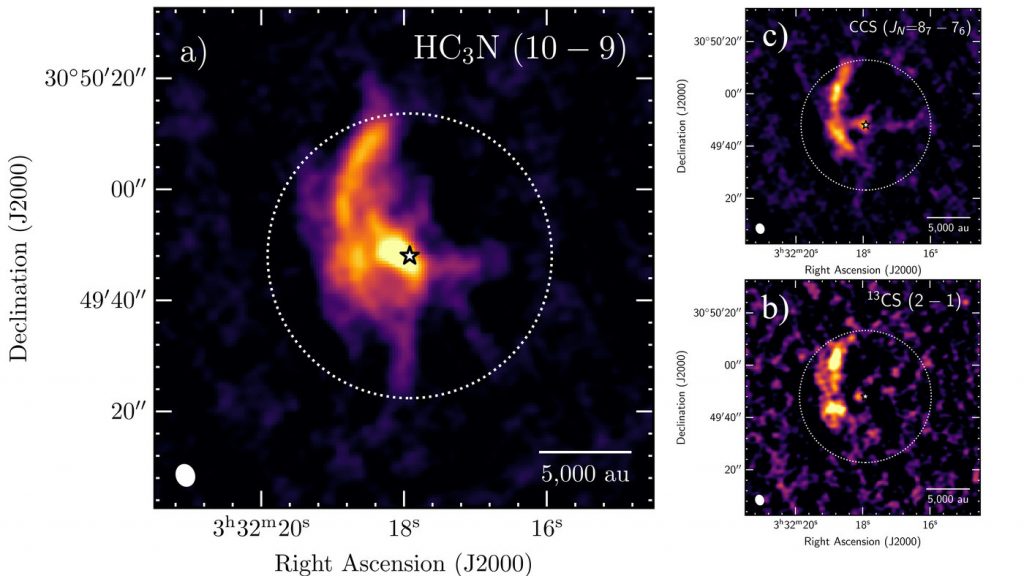
In a new paper in Nature Astronomy, a team led by Jaime Pineda describes how young stars fed on an infalling stream of material that stretched 10,500 AU in length. This distance is roughly 350 times greater than the distance to Neptune or Pluto. In this system, IRAS 03292+3039, a binary system is forming at the center of a rich disk of material. Over time, these stars would deplete the disk if there wasn’t new material continuing to flow in from the surrounding molecular cloud.

While we’ve understood this process for a long time, the inflow of material hadn’t been directly seen until now. Using the IRAM telescope, which works in millimeter wavelengths of light, they were able to map the flow of material in the Perseus Molecular Cloud in high enough resolution to see how material flowed from the surrounding cloud into the forming binary system. They looked at the light from three specific molecules, detailing how different material is flowing, and they estimated that between 0.1 and 1 solar mass is in the stream. According to Pineda: The streamer must indeed bring in chemically fresh material from the outer regions on a relatively short timescale. The clear identification of such a large reservoir of fresh material in almost free-fall is remarkable.
The streamer may represent a single moment in time and may not be a long term feature or even a common feature. More observations of more star-forming systems are needed, but at least now we know these kinds of features can exist and play a role in feeding young solar systems.
Astronomy is forever in pursuit of more details, and the more we see, the more we often realize we don’t understand. Even our Sun has phenomena that we struggle to understand even though that star is right beside us.
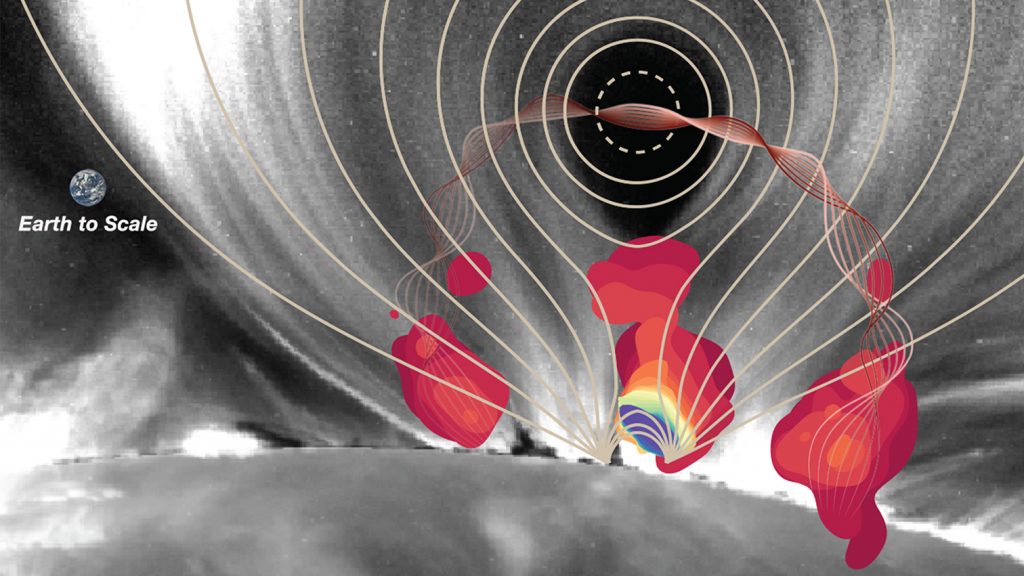
In another paper in Nature Astronomy, this one with lead author Bin Chen, scientists look into the heart of a solar flare and work to understand what factors power these giant rings and streams of plasma. Using data from the Owens Valley Solar Array, which observes the sun in microwave wavelengths of light, they analyzed a powerful solar flare from 2017. This event generated a 40,000-kilometer sheet of electric current that accelerated electrons to high energies.

According to Chen: How exactly this happens is not clearly understood, but it is thought to be related to the Sun’s magnetic field. It has long been suggested that the sudden release of magnetic energy through the reconnection current sheet is responsible for these major eruptions, yet there has been no measurement of its magnetic properties. With this study, we’ve finally measured the details of the magnetic field of a current sheet for the first time, giving us a new understanding of the central engine of the Sun’s solar flares.
Specifically, according to co-author Kathy Reeves: We found that there were a lot of accelerated particles just above the bright, flaring loops. The microwaves, coupled with modeling, tells us there is a minimum in the magnetic field at the location where we see the most accelerated particles, and a strong magnetic field in the linear, sheet-like structure further above the loops.
These sheet-and-loop magnetic structures work together to pump 10-100 billion trillion joules of energy out per second.
To understand how these fields work together, they used sophisticated computer models that had to match what they saw in detail, including the thin reconnection current sheet and the magnetic field configuration during the eruption. From this model, they could see what underlying physics drives these eruptions and how magnetic fields can generate the plasma inflow/outflow that is seen reconnecting the current sheet.
This is a case of high-resolution images being required to confine a highly detailed analytical model, which in turn gives us a detailed understanding of the physics. Sometimes, we can’t just write down the equations and work out reality, but by combining the too-many equations only a computer model can manipulate with a detailed picture of reality, we can use physics to understand our universe. And sometimes that is enough.
Even on a Blursday.
Learn More
The Ultimate RAVE — Final Data Release Published
- Leibniz Institute for Astrophysics Potsdam (AIP) press release
- “The Sixth Data Release of the Radial Velocity Experiment (RAVE). I. Survey Description, Spectra, and Radial Velocities,” Matthias Steinmetz et al., 2020 July 27, Astronomical Journal (Preprint on arxiv.org)
- “The Sixth Data Release of the Radial Velocity Experiment (RAVE). II. Stellar Atmospheric Parameters, Chemical Abundances, and Distances,” Matthias Steinmetz et al., 2020 July 27, Astronomical Journal (Preprint on arxiv.org)
A Growing Stellar System Directly Fed by the Mother Cloud
- Max Planck Institute for Extraterrestrial Physics (MPE) press release
- “A Protostellar System Fed by a Streamer of 10,500 AU Length,” Jaime E. Pineda, Dominique Segura-Cox, Paola Caselli et al., 2020 July 27, Nature Astronomy
Scientists Look Inside Central Engine of Solar Flare for First Time
- Center for Astrophysics (CfA) press release
- “Measurement of Magnetic Field and Relativistic Electrons Along a Solar Flare Current Sheet,” Bin Chen, Chengcai Shen, Dale E. Gary et al., 2020 July 27, Nature Astronomy (Preprint on arxiv.org)
Credits
Written by Pamela Gay
Hosted by Pamela Gay
Audio and Video Editing by Ally Pelphrey
Content Editing by Beth Johnson
Intro and Outro music by Kevin MacLeod, https://incompetech.com/music/


 We record most shows live, on Twitch. Follow us today to get alerts when we go live.