
The numbers are in. 2024 was the hottest year on record, and global average temperatures were up 1.5℃ compared to pre-industrial levels. This increase is what scientists have been saying we must avoid if at all possible, and now that we’re here, we’re seeing our world change in ways that make forecasting the weather exceedingly more difficult, and make keeping us all alive somehow even more difficult than predicting the weather…
As a reminder, a change in the average means that some places could have gone down 10 degrees while others went up 20 degrees. We have had substantially warmer temperatures in polar regions, with wild variations in mid-latitudes. Here in southern Illinois, we’re seeing record highs and lows at all points throughout the year. Results will vary from place to place, but in general, what we are all experiencing is a change in weather patterns and what plants and animals can and do thrive in which ecosystems.
Human beings are among those animals not always thriving that well in our changing world.
Human habitable zone on Earth is shrinking
Since 2000, there have been over 260,000 heat-related fatalities, with more than half occurring during three separate heatwaves, including the 2003 heatwave in Europe, the 2010 heat wave in Russia, and the 2022 heat wave in Europe.
These unintended experiments with human life have taught us that somewhere between wet bulb temperatures between 20 and 34 ℃ or 68 and 90F, our environment becomes unsurvivable even for people able to stay hydrated and stay in the shade.
Those temperatures likely sound confusingly low, but the key is that they are discussing a wet bulb temperature and not the standard air temperature. This is the temperature you get if you put a wet cloth around a thermometer exposed to outside conditions, including sun and wind, to simulate the effects of sweating. The wet bulb temperature is generally lower than the temperature you will see from a weather station and can actually be substantially cooler in some situations, like high wind and low humidity.
In general, older people are much more heat intolerant than younger people, but anyone can be struck down by heat exhaustion.
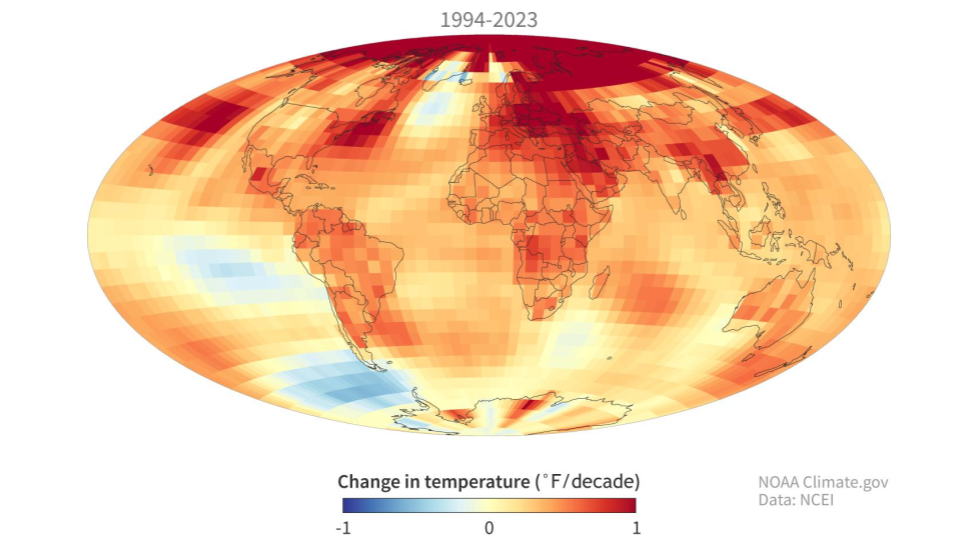
Between 1994 and 2023, 20% of the earth’s landmass exceeded the generally safe limits for people over 60, and temperatures hit the “people under 60 will potentially die” threshold for 2% of the planet.
Things will only get worse as temperatures rise, according to a new paper in Nature Reviews Earth & Environment led by Tom Matthews. The percentage of the Earth that hits intolerable temperatures will increase as our world’s average temperature increases. If temperatures go up just another ½ degree, we’ll see more than a third of our planet surpass safe temperatures for people over 60, and 6% of the planet’s land mass will become unsafe for even healthy younger humans.
And while people die, based on their health, with prolonged exposures to air temperatures still below 100 F or 38℃, we’re seeing temperatures exceeding 50℃ or 122F.
It’s easy to say, “just turn on the AC” or “go to cooling centers”, that isn’t an option for the unhoused, or people living in tents in areas of the world dealing with war and natural disasters. Power shortages in industrialized places, like California, can cause widespread power outages. And pride and pets can keep people from wanting to leave their homes.
What we have done to our world won’t kill our planet, but it can kill us.
Glaciers on Earth are shrinking
As the human habitable zones shrink, so too do the glaciers. A new study in Nature Geoscience led by Thomas Chudley looks at the accelerating growth of crevasses in Greenland’s glaciers. Their study looked at the ice from 2016 to 2021. They find that “the acceleration of ice flow in Greenland forces significant increases in crevassing on timescales of less than 5 years.”
Using satellite data and new machine learning software that automated crevasse detection and measurement using 3D Satellite imagery, they looked at crevasse growth in size and number. Overall crevassing is increasing, and the growth of crevasses is increasing.
Study researcher Emma Mackie points out “Crevasses can induce accelerated ice flow, leading to more crevassing. So there are these potential positive feedback loops caused by crevassing. This mechanism should be considered in Greenland ice sheet models that we’re using to project future sea level rise.”
Greenland’s ice melt has added about 10mm to sea levels since 1992 and is estimated to add another 30cm by the end of the century.
Looking toward the Southern Hemisphere, we’re seeing large chunks of ice sheet break free. In 1986, an ice sheet cataloged as A23a broke away from Filchner–Ronne Ice Shelf. Initially it was grounded on the sea floor, but eventually, it broke free only to get stuck spinning in ocean currents. In 2024, however, it got totally unstuck and moved into the Antarctic circumpolar current and started to make its way toward warmer waters. With a surface area of about 3500 square kilometers this is the largest iceberg in the world.
And it is on a collision course with South Georgia Island.
Its location is being monitored by NOAA’s GOES 16 satellite, and data that was still available on NOAA’s website on Feb 9 show it is still in the open ocean. If it does strike the tiny island, it could block access to the open ocean for the penguin colonies that call Saint Georgia home.
As we learn more, we’ll provide updates on this story.