
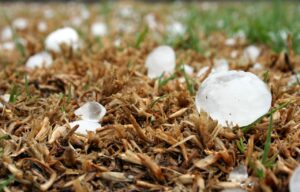
I’ve lived in my home for 17 years, which is the longest I’ve ever lived in one place. I like to garden, I participate in outdoor sports that are year-round, and this long-for-me timeline and familiarity with the outdoors means that I feel safe saying that things are changing. After years of wondering which will come first, the last snow or apple blossoms, the question is now which will come first, the air conditioning needs to be turned on or apple blossoms. Tornadoes now hit in December and hail the size of golf balls has hit the county twice in one month instead of twice in one decade. In talking to our roofer, I’m learning that insurance companies are changing from having deductibles to just prorating the cost of things, like what happens with cars, because weather-related damage is becoming too common for their prior business model.
When I first became deeply worried about climate change in 2003, I, like many, thought climate change-related disasters would be far in the future — 2050 and beyond.
But globally, the changes are happening now, they are happening fast, and it is time for an update. This is your periodic reminder: Earth is a planet, and we have to study it even if we want to focus on what’s going on beyond the clouds.
While our world, by percentage, doesn’t count as a water world, the surface of the planet is dominated by the ocean and the flow and pooling of water across the landmasses.
To truly understand how climate change will affect us, let’s start with ocean levels.

A new NASA release finds global average sea levels rose by 0.3 inches in 2023 due to a warming climate that encouraged the development of a strong El Niño. To put this in perspective, they explain this is the equivalent of emptying one-quarter of Lake Superior into the ocean, except that this didn’t require extra water from something like melting glaciers. This effect came from extra heat.
According to Josh Willis, a sea level researcher at NASA JPL, “In El Niño years, a lot of the rain that normally falls on land ends up in the ocean, which raises sea levels temporarily.”
But not all changes are temporary.
Since 1993, a total sea level rise of 9.4 cm or almost four inches has been seen, with seasonal oscillations related to temperature. It is anticipated that by 2040, we’ll have more than an eight-inch rise. While this sounds like next to nothing, this kind of rise will flood lowland marshes, glades, and wetlands, essentially reclaiming swaths of coastal states and nations. This will devastate historic cities like Venice and New Orleans, and impact millions in megacities like Jakarta, Shanghai, Mumbai, Hong Kong, and Bangkok.
As fellow JPL sea level researcher, Ben Hamlington, points out: “Long-term datasets like this 30-year satellite record allow us to differentiate between short-term effects on sea level, like El Niño, and trends that let us know where sea level is heading.”
And it is heading up.
It’s not just ocean levels that are changing. We are slowly – or not so slowly, depending on your way of thinking – rearranging the distribution of water on and within our planet. While it’s possible to mechanically measure in some places the amount of water in aquifers and the changing depth of the water table, to assess the entire planet, we need satellites. Currently, the GRACE-FO spacecraft pair is circling the Earth and measuring the increases in gravitational pull that occur whenever they are over a region that has enhanced density. By orbiting along the same path over and over, year after year, it becomes possible to see how water tables rise and fall.
To ensure we have continued access to this information, NASA and the German DLR have announced they are collaborating to build the next generation of a pair of spacecraft.
Past data from the GRACE mission have precisely measured the ice loss in Greenland at 280 billion tons and 67 billion tons from Antarctica in the window from 2003 to 2013. They have shown the change in mass distribution with the 2004 Indian Ocean Tsunami as the Earth’s crust shifted, and they have helped measure the more subtle variations caused by droughts, flooding, and other redistributions of water in the landscape.
To the great frustration of anyone tasked with budgeting for the future, spacecraft, which are extremely expensive to build and launch, are really our best way to monitor our world. Unfortunately, it just isn’t in the budget to build satellites the way we used to.
However, some researchers are finding other ways to get the data we need.
In a new paper in Geophysical Research Letters, researchers led by Yunju Zhang discuss how they have figured out how to incorporate existing data in new ways that can predict significant weather events.
Currently, microwave data obtained from low-earth orbit satellites is – for the most part – not used in the major computer models that provide our weather forecasts. Infrared images, which tell us where cloud tops are located and effectively trace clouds and clear skies, are the norm. Microwave data, however, can map out the distribution of clouds at all altitudes and provide the density of moisture as a function of altitude.
In their new study, this team integrates microwave all-sky brightnesses into updated models and then challenges the models to reanalyze historic data and create predictions that can be compared against what we know has happened.
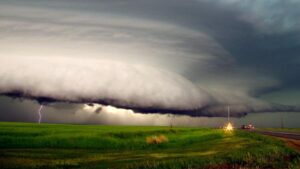
And the model worked. According to Zhang, in looking specifically at the 2020 Midwest Derecho, which damaged a large swath of the northern U.S. and southeastern Canada, they found, “The computer model is able to produce a series of forecasts that consistently emphasize the most powerful storms and strongest wind damage at where it happened.”
In areas with ground radar and a large density of weather stations, this is good news, but it won’t make a huge quality of life difference. For places without that data, this can mean survival when the nastiest storms are on their way. As Zhang goes on to explain, “If we have this kind of information in real-time before the events occur, forecasters might be able to pinpoint where the strongest damage is going to happen.”
And, as my roof can tell you, damaging weather is becoming more common. Luckily, I have a new roof and a house that has withstood midwestern storms for 140 years. I have a couple of leaks, but some paint and a new roof will get everything fixed up and until then, the leaks aren’t that bad.
In other places, construction didn’t have severe weather in the plan.
As Zhang explains, “We know that there have been several times in the past several years in West Africa where very strong torrential rainfall events have brought on a lot of precipitation to those countries. And one thing about these countries is that they are also the places that will likely be impacted most by global warming. So I think if we can use these available satellite observations to provide a better forecast for those regions, it will be really beneficial for the people there as well.”
We can’t expect to see our weather prediction software making big changes to incorporate this data in the near future, but we at least see a path forward that may make living on a changing planet a little bit easier, no new satellites required.
Climate change is one of those things we need to accept, plan for, and budget for. The next generation isn’t going to have an easy time of it, but with enough data and science, we will continue into the future.