
In this series of posts, we’ll be breaking down the recent MoonMappers paper by Robbins et al. showcasing YOUR work.
Read Part 1 and Part 2
Won’t The Real Crater Count Please Stand Up?
Now that we’ve set up why we’re counting and measuring craters and reviewed the history of the methods of crater counting, let’s see what these eight crater experts and their seven different methods come up with when they are all asked to look at the same image from the Narrow Angle Camera (NAC) on the Lunar Reconnaissance Orbiter (LRO). The first thing to note is that the experts differ from each other in the number of craters counted, no matter what sizes of craters they are marking. In fact, they differ by at least 20% between among them, and sometimes as high as 30%. So what is the REAL crater count?
There is no one definitive number to settle this question. There is no “answer at the back of the book.” That is what is both fun and frustrating about cutting edge science. So, making a reasonable assumption that we can combine all of these experts counts in some way to get as close to a “true” answer as we can, we look at the average (or mean) and middle (or median) values of the crater counts for each size. If the crater counting was uniformly distributed among the experts and their various methods, those two numbers, the mean and the median, would equal each other. But, they do not. However, they are quite close and give a more precise result that just looking at any one expert’s work alone.
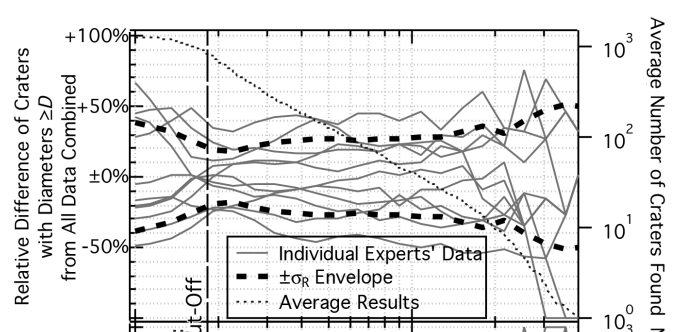
Fig 3 from Robbins et al. The solid lines represent one expert using one method. The standard deviation, or “error bars” are determined by the thick, dashed lines.
There is an even smarter way to combine that data, and it’s the clustering code mentioned in the last post. That code takes all the crater marks from all the crater marking people and tries to figure out when multiple people are marking the same crater. This makes one crater catalog of the whole image. Now, not every crater-looking thing gets marked by all eight people. So how many people need to agree before we can call it a crater? For most crater sizes, if at least 5 out of 8 experts have marked it as a crater, the count closely matches that of the mean and median of all the experts put together. This means that five experts is the minimum number to input in the clustering code for the catalog it produces to be considered, in some sense, accurate, or close to the “truth.” (Again, it is hard to say that there is one objective “crater truth,” but that’s a philosophical discussion more than anything.)
This analysis is repeated for an image from the Wide Angle Camera (WAC) that has a section that is relatively young and undisturbed (mare) and a section that is older and more heavily cratered (highlands.) Again, the median and mean for all the experts combined is taken into account and compared with the results of the clustering code. For these images, a crater only needs to have been identified by four of the experts for the counts to match, so that is taken as the standard in this case. (There are two less datasets here since the MoonMappers interface wasn’t used by Stuart and Irene for these images.)
MoonMappers in the Mix

Figure 5 in Robbins et al.
Each of the experts have one or two favorite methods for identifying craters in the images from LRO. MoonMappers was specifically designed to be a user-friendly browser tool to allow citizen scientists to access the data without having to install anything new onto your computer. So, it makes sense to test this new interface to see that it still provides accurate results when used by two experts, Stuart Robbins and Irene Antonenko. Stuart took a crack at the image with MoonMappers and a tool called ArcGIS, and his results from each one match up well to each other, except at the smallest crater sizes. He marked less small craters in MoonMappers. Irene, on the other hand, used three methods: MoonMappers, ArcGIS, and JMARS. When using ArcGIS, there was a conscious decision to NOT mark the most heavily degraded craters, so its count (in red) is a little lower than the others. Otherwise, her results also match up to each other except, again, at the very smallest crater sizes. That limitation will come up later in the paper, but this shows that overall, MoonMappers is a pretty solid tool for counting and measuring craters.
The Volunteers Weigh In

Figure 6 from Robbins et al, comparing the volunteers (blue), Stuart (green) and Irene (red). Crater size is on the x axis and crater counts on the y-axis. Click for larger view!
Now we’re ready to look at how the volunteers stack up against the experts. The variation among volunteers is greater than the variation among experts. But when you get right down to it, the combined efforts of all the volunteers match the expert data at least as well as the experts match each other! If using the clustering code, you need to have had at least seven people marking a particular crater before it gets counted in a way that matches the expected crater count if we treat the experts’ results as ‘expected.’ (Keep in mind there is no ‘true’ answer that we can know.) So, with greater individual variability, you need more confirmations to get the answer. This works over most crater sizes, from 30 to 500 pixels across in the image. Any smaller than that, however, down to the 18-pixel limit of the MoonMappers interface, things get a bit weird. The volunteers seems to be over-counting features at this size range, so that is something to keep in mind in future analysis.
So that’s the heart of it: taken together, the volunteers, YOU all, using MoonMappers can get the job done as well as the experts. There are a lot more factors to consider, however, and we’ll explore that in future posts.
This series of posts is about the recent CosmoQuest publication: Stuart J. Robbins, Irene Antonenko, Michelle R. Kirchoff, Clark R. Chapman, Caleb I. Fassett, Robert R. Herrick, Kelsi Singer, Michael Zanetti, Cory Lehan, Di Huang, Pamela L. Gay, The variability of crater identification among expert and community crater analysts, Icarus, Available online 4 March 2014, ISSN 0019-1035, http://dx.doi.org/10.1016/j.icarus.2014.02.022 (paywall)
FREE, open access preprint on arXiv – http://arxiv.org/abs/1404.1334


 Escape Velocity Space News
0 Comments