The last two months have gone by quickly here as we’ve gone through beta and just now officially launched. In that time, you have identified over 150,000 craters and 4000 other features while supplying us with feedback on the interfaces, design, and other things.
With that, we will be presenting a poster at the Lunar and Planetary Science Conference (LPSC) tonight, starting in just about four hours. LPSC is one of the two major planetary science conferences in the United States with thousands of scientists attending interested in a variety of fields. People are already starting to walk by our poster as it hangs in the exhibit hall (I saw someone reading it while I perusing a few minutes ago, myself).
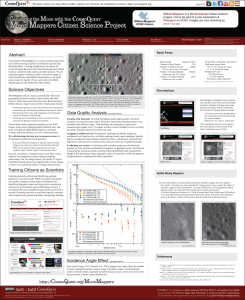
A small version of the poster is below, which you can click on to embiggen to a somewhat readable size.
The left column of the poster details the basic idea of MoonMappers including our main science goals at the moment.
The right column talks more about how MoonMappers works (“The Interface”), where we’re having you look, and it gives some stats at the top.
The middle column is the meat of the poster. The top section is what we do with all the craters that you identify and it shows a image similar to ones I’ve done on this blog before, such as this post, but it also talks about the basic training (100 push ups, NOW!) we put you through and how we use the scores that are assigned based on how well your markings match up with an expert’s.
The large double graph in the middle is an early version of what will be in the first science paper, the results of the effects that lighting angle plays on crater identification. The top and bottom graph show the same thing but in different ways, so I’ll just briefly talk about the top one.
The top graph is showing what we call a “cumulative size-frequency distribution.” This is a fancy name for a histogram. What we do is create a histogram with diameter on the x axis and number of craters per diameter bin on the y axis. This would be an incremental size-frequency distribution. This is then integrated – summed – from large to small diameters to make a cumulative version. For example, in the cumulative version, the value at the 100-meter bin is now many craters are in the region that are larger than 100 meters. In the 50-meter bin, it’s how many craters are larger than 50 meters. This kind of graph has been used for decades to study crater populations.
What you’ll notice is that the red and yellow data are below the green and blue. The red are for craters found when the sun makes a 35° angle with straight overhead, yellow is 58°, green is 77°, and blue is 83°, or almost right on the horizon.
What it shows is that the lower the sun is, the better you can see craters. We want to get more data to be able to draw more conclusions (like, do the craters “move” when sun angle changes? does the diameter measured appear different?), but this early result is reassuring that (a) we’re seeing some effect, and (b) that things are working right on the interface and database end.
I should be standing by our poster for the full three hours tonight, actually wearing something other than my normal t-shirt and shorts. Irene, the second author and other Science co-Lead, has her own separate poster tonight but she should be by for a bit, while Pamela will be there at times, as well. Poster sessions work by the author(s) standing at their poster and engaging with people as they stop to read and ask questions. It’s usually a fairly fast-paced event and lots of people see lots of things, but we should get good exposure for the project!


 Join the Crew!

 Escape Velocity Space News
0 Comments